Examination of three-time scales reveals interesting clues for the S&P 500 (SPX).
The weekly SPX chart courtesy of Trading View illustrates the long-term view.
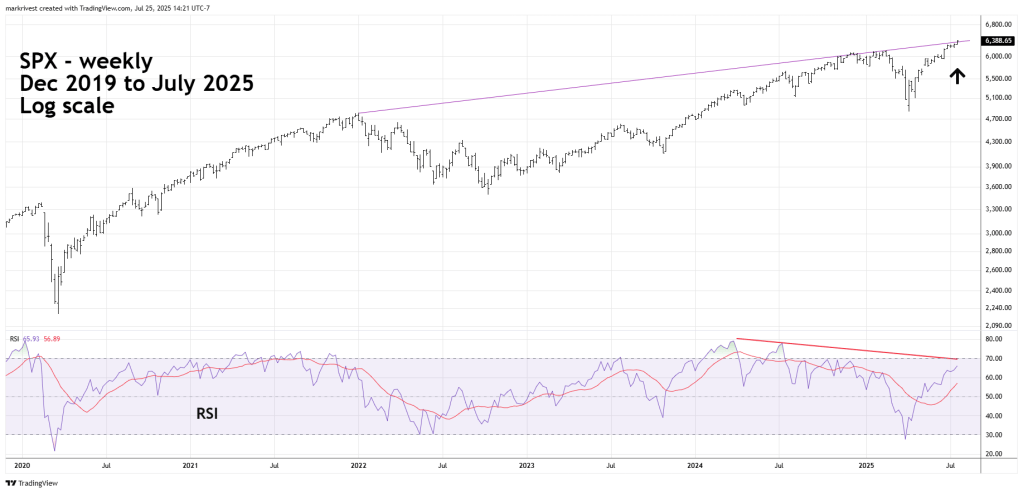
Last week the SPX went marginally above the long-term rising trendline connecting the January 2022 and February 2025 peaks. This movement corresponded with a significant weekly RSI bearish divergence. The combination of these factors suggest the SPX could be on the verge of a multi – week or even a multi – month decline.
Could a major SPX peak be in place on 07/25/25? Zooming in on the daily chart reveals additional evidence.

On 07/25/25 the SPX – daily RSI reached its highest level since the rally began on 04/07/25. Stock indices almost always need at least one RSI bearish divergence before a significant peak could be in place. The maximum RSI reading implies more SPX upside action.
Also note the rising daily trendline. It’s possible the SPX could get closer to this line in the next one or two weeks. Further SPX upside action could bring it in proximity to both the daily and weekly rising trendlines.
The lower rising trendline could provide support. A significant break below the lower trendline could be an important bearish signal.
The hourly SPX chart zooms in on the intraday action.

During the SPX 07/25/25 session it hit the rising trendline connection the 07/21/25 and 07/24/25 peaks. Please note this movement occurred with an hourly RSI bearish divergence. Watch the lower blue trend line on 07/28/25, a decisive break below this line could be the signal for a multi – day decline.
The most likely near-term scenario is that an SPX short-term peak was made on 07/25/25 followed by a two or three trading day decline. A new SPX all-time high could be made on 07/31/25 or 08/01/25.
The Trump tariff deadline is August 1, 2025.
