In a shortened pre – holiday session the S&P 500 (SPX) blasted up to new highs. Near – term U.S. stocks could climb higher. In the longer – term the post 04/07/25 stock rally is probably the termination phase of a secular bull market that began in March 2020.
Prior blogs on this website illustrated potential Fibonacci resistance at SPX 6,202 and 6,208 with a broad leeway zone from 6,190 to 6,215. On 06/30/25 the SPX peaked at 6,215 and it appeared an important peak could be in place.
On 07/02/25 the SPX reached 6,224 above the leeway zone hinting at more upside action. What happened on 07/03/25 was spectacular and surprising considering the day it happened.
The hourly SPX chart courtesy of Trading View illustrates intraday momentum.
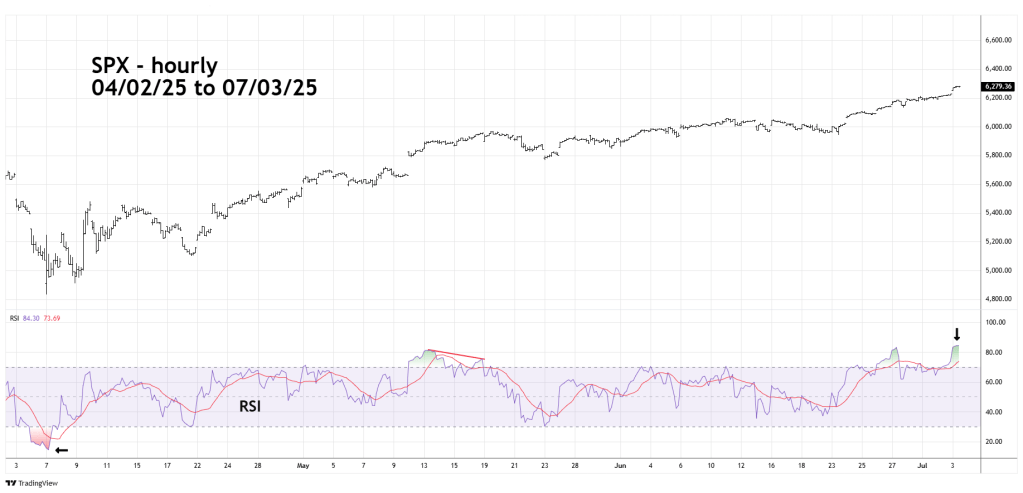
Hourly SPX – RSI has again made another post 04/07/25 rally high. On 07/03/25 hourly RSI reached 84.30 deep in the overbought zone. This is the highest hourly reading since 08/19/24 when it reached 87.30. Usually, stock indices could turn when there’s at least one RSI divergence. There are of course exceptions. Please note the SPX 04/07/25 bottom corresponded with a maximum RSI downside reading.
The current maximum overbought reading implies a short – term decline followed by a rally to another new high. This presumed action could occur in the next one or two weeks. If the SPX hourly RSI has a bearish divergence with a price it could signal an important peak.
If there’s more upside SPX action where could an important peak occur?
The weekly SPX chart examines the next potential resistance area.
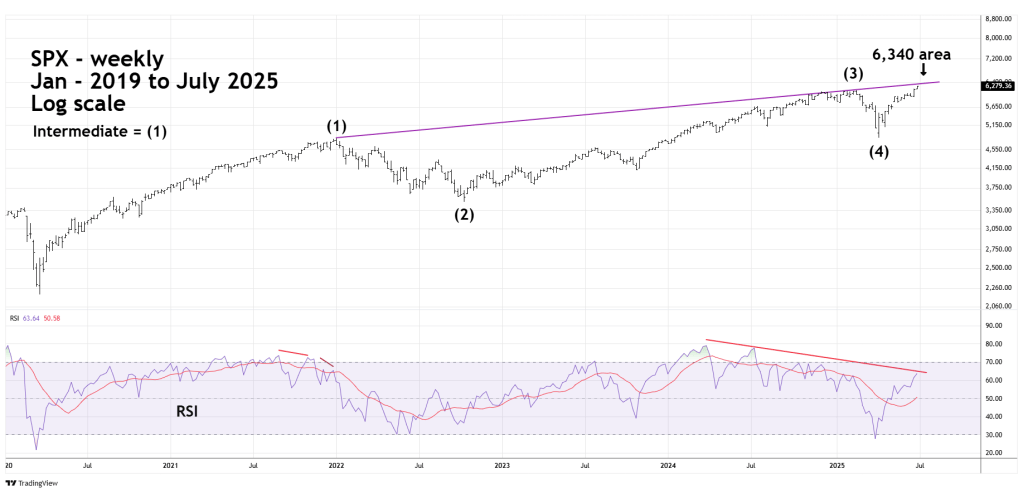
The SPX is nearing the long-term rising trendline connecting the January 2022 and February 2025 peaks, which is around the 6,340 area. This zone could be reached in the next one or two weeks. Please note the weekly RSI significant bearish divergences.
A very suspicious aspect of the SPX all-time high on 07/03/25 was that it occurred during a holiday shortened session. This phenomenon will be examined in the next blog.
To all Americans.
Happy Independence Day!
July 4, 2025.
