The Israel attacks on Iran triggered a seven percent move up in Crude Oil price. This surge could be the early part of a multi-month bull market.
The monthly Crude Oil – Continuous contract (CL2!) chart courtesy of Trading View illustrates the long-term view.

A three-year Crude Oil bear market may have concluded at the April 2025 bottom. The decline took the form of an Elliott wave – Single Zigzag with an Elliott wave – Inverse Horizontal Triangle at the mid – portion of the decline.
Note the shallow choppy nature of the decline from late 2023 to early 2025, this is the signature of a bear market losing strength. The final decline in April 2025 designated as Minor wave “C” is probably a post Horizontal Triangle thrust down – a selling climax.
The April 2025 bottom was near a Fibonacci .618 retrace of the 2020 to 2022 bull market.
On the subsequent rally, monthly Stochastic had a bullish line cross. Monthly RSI has crossed its moving average line. MACD – Histogram had a bullish divergence at the April 2025 bottom.
The weekly Crude Oil chart examines the action since the 2022 bull market peak.
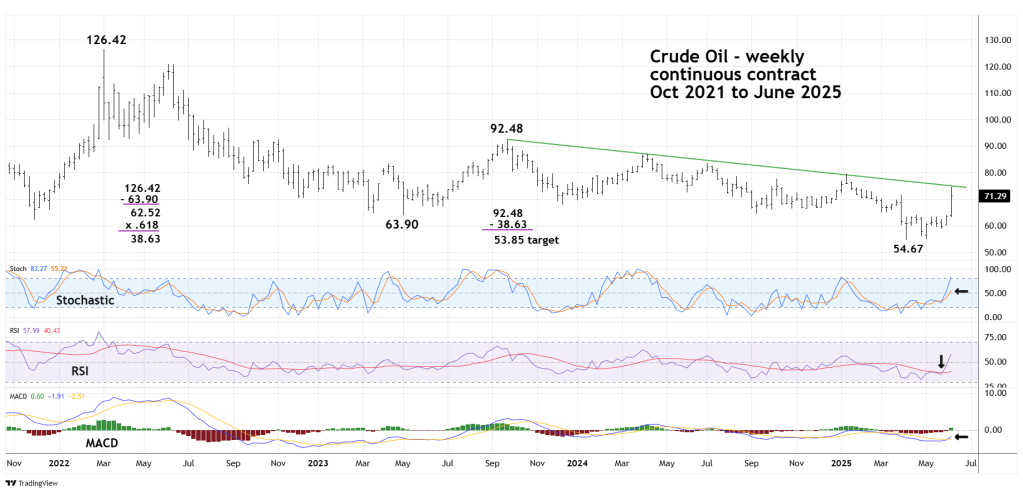
There’s a secondary Fibonacci coordinate derived from the bear market movement.
The first phase of the decline from 2022 to 2023 was 62.52 points, multiplied by the Fibonacci ratio of .618 equals 38.63 points. The September 2023 peak was 92.48 minus 38.63 targets 53.85. The early 2025 April bottom was 54.63. The .618 retracement of the 2020 to 2022 bull market is 58.97. Crude Oil bottomed out between the two Fibonacci coordinates.
Only one line of the weekly Stochastic has reached the overbought zone. Weekly RSI has a bullish line cross. Weekly MACD has a bullish line cross.
The main obstacle for the bulls is the declining trendline from the September 2023 peak. A move above the trendline could open the door for a multi – month move to the 100.00 area.
Inflation is the primary fear for the U.S. economy. A continuing rise in Crude Oil could be bearish for U.S. stocks.
