This website’s 05/25/25 blog illustrated that the S&P 500 (SPX) had a potentially bearish Elliott wave count. As it turns out the SPX – 200 – day Simple Moving Average (SMA) line support held.
The daily SPX chart courtesy of Trading View illustrates what happened.
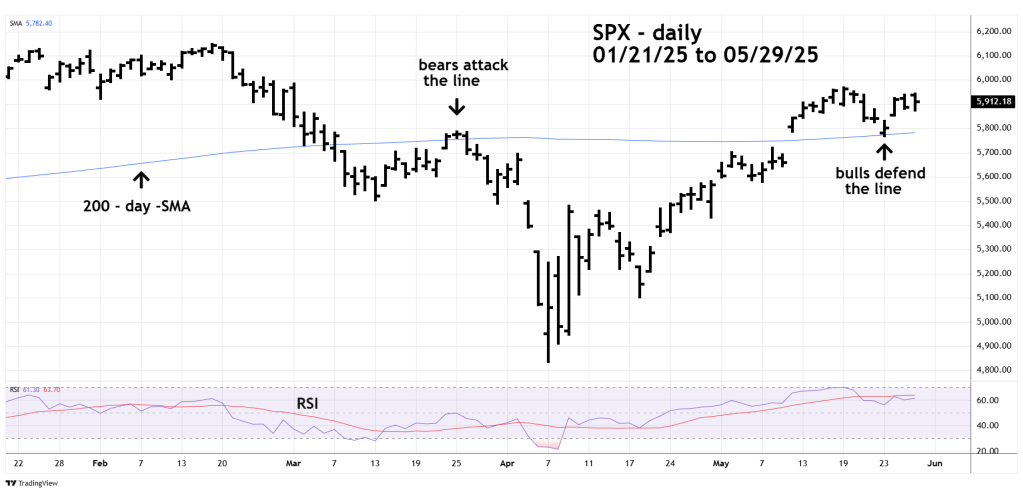
Most of the time a market or stock will trend along with their 200 – day SMA. It’s when the line is approached that the battle begins.
In mid-March the bears successfully pushed below the line, and on 05/23/25 the bulls successfully defended the line.
The 15 – minute SPX chart shows a shorter-term stock bull victory.

On 05/29/25 the SPX smashed through it prior day low, and it briefly appeared this could be the start of very powerful move down. However, the .382 Fibonacci retracement of the 05/23/25 to 05/29/25 rally was just below the 05/28/25 bottom and this acted as support. The Fibonacci support was also very close to the rising trendline connecting the bottoms made on 5/23/25. Please note the significant RSI bullish divergence made at the 05/29/25 bottom.
Also, the intraday move down on 05/29/25 appears to be an Elliott wave – Zigzag correction of the prior uptrend.
The weight of short-term evidence favors the bulls and implies the SPX could soon exceed the 05/29/25 peak.
The SPX bottom made on 05/29/25 is important support. A move below the 05/29/25 bottom could open the door for a move back to the SPX 200 – day SMA.
