The 03/16/25 blog “Forecast – S&P 500 Intermediate Bottom – 04/03/25” illustrated that the S&P 500 (SPX) could bottom in the 5,100 area on 04/03/25 or 04/04/25. The price forecast remains the same and given the SPX powerful decline on 03/28/25 it’s possible to reach 5,100 by 04/03/25 or 04/04/25. However, there is another time target to examine.
First, we need to look at the spectacular downside action that occurred on 03/28/25 illustrated in the SPX one – hour chart courtesy of Trading View.
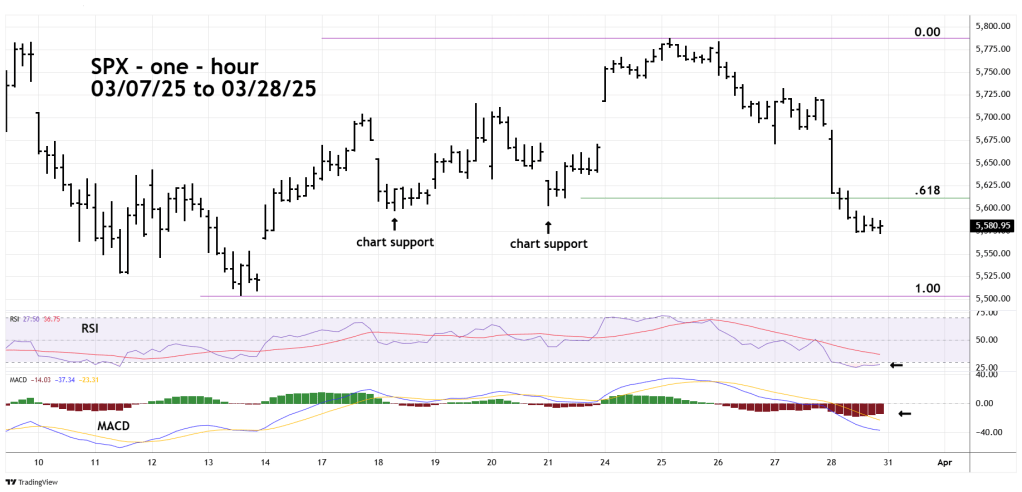
The SPX broke below the Fibonacci .618 retracement level and two areas of chart support. Note there is no chart support until the 03/13/25 bottom.
One – hour RSI has reached the oversold zone with a tiny bullish divergence. Given the relentless nature of the decline on 03/28/25 it would not be surprising if the hourly RSI went deeper into oversold territory.
MACD – Histogram has only a tiny bullish divergence. This indicator typically has much larger bullish divergences before a significant bottom is made.
The daily SPX chart examines the alternate time forecast.
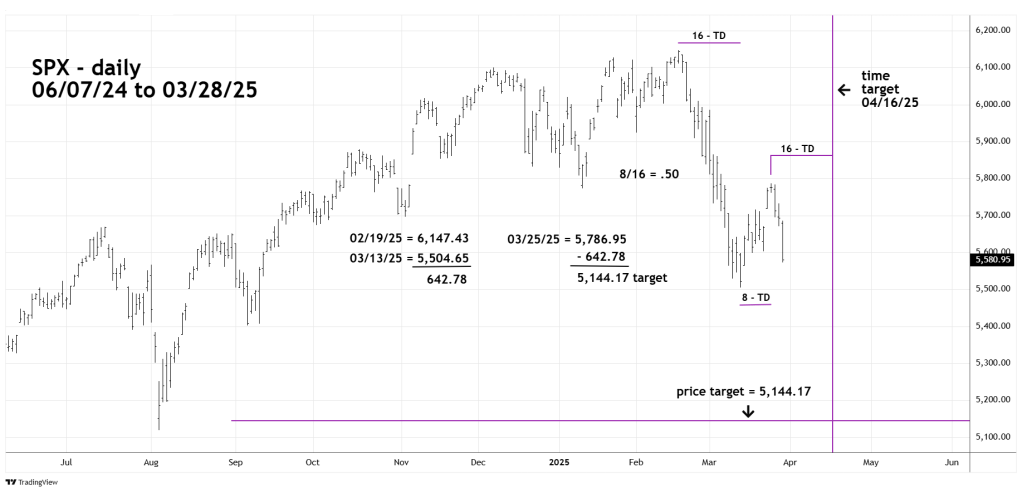
Corrections to the primary trend are usually proportional both in price and time.
The SPX 02/19/25 to 03/13/25 decline was 16 – trading days (TD). The subsequent rally 03/13/25 to 03/25/25 was 8 – trading days. The ratio of 8/16 is a Fibonacci .50. Assuming the next decline could equal the February to March drop, 16 trading days after the 03/25/25 peak targets 04/16/25 as a possible bottom target date.
Another alternate time ratio could be the next decline equaling the prior rally of 8 – trading days. Adding 8 – trading days to the 03/25/25 peak targets 04/04/25, this is the same time target illustrated in the 03/16/25 blog!
The potential price proportion is also fascinating.
The SPX 02/19/25 to 03/13/25 decline was 648.78 points. The SPX 03/25/25 peak was 5,786.95 subtracting 648.78 targets 5,144.17 very close to the August 2024 mini – crash bottom of 5,119.26.
The powerful move down on 03/28/25 strongly implies more downside action, if so, how much?
U.S. President Donald Trump has said that 04/02/25 will be “Liberation day” a moment when he plans to roll out a set of tariffs that he promises will free the United States from foreign goods.
Could this trigger a mini – crash?
For stock fund managers liberation day could be liquidation day.
