The S&P 500 (SPX) move up from the 03/13/25 bottom has the choppy look of an Elliott wave corrective pattern.
The daily SPX chart courtesy of BigCharts.com updates the bigger picture.
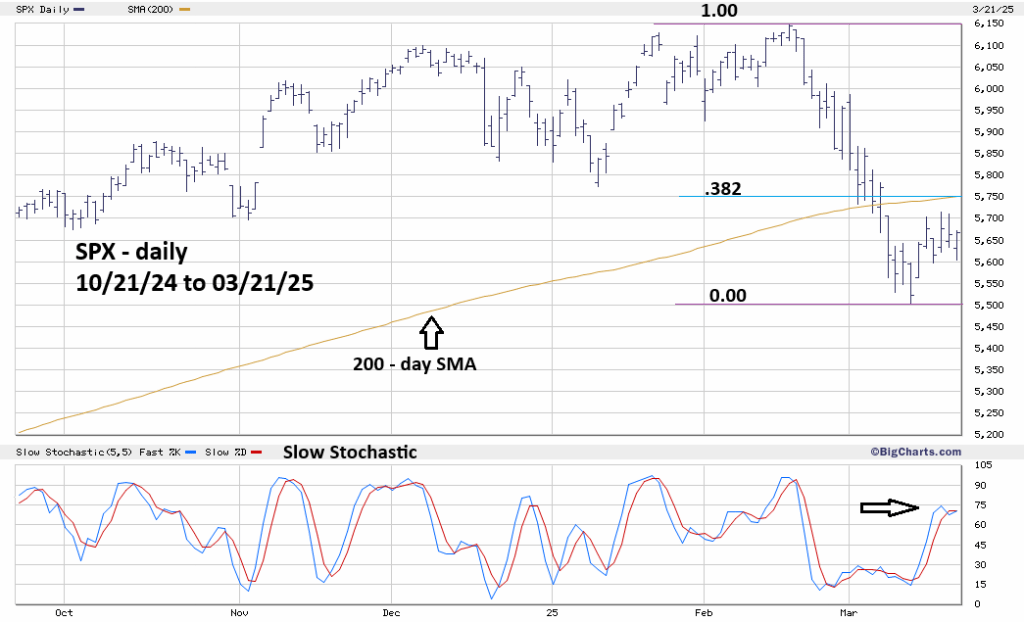
The BigCharts.com Slow Stochastic indicator is very effective in identifying market turns. So far, Slow Stochastic has not reached the overbought zone which begins at 80.00. It could become overbought if SPX reaches the 5,750 area.
The 200 – day Simple Moving Average (SMA) is now intersecting with the Fibonacci .382 retracement level of the 02/19/25 to 03/13/25 decline. The 200 – day SMA in proximity to the .382 retracement level could be powerful resistance.
The SPX 15 – minute chart courtesy of Trading View zooms in on the short-term picture.
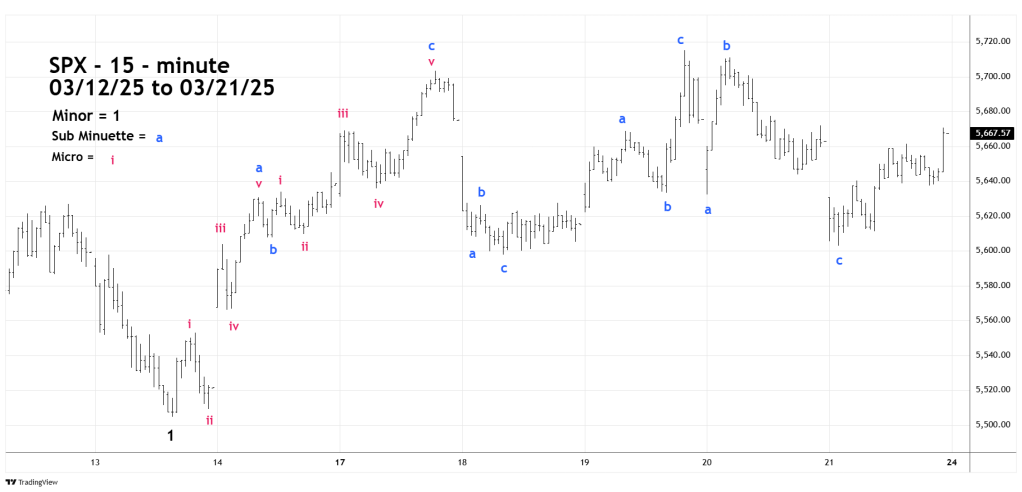
The most interesting part is the 03/13/25 to 03/17/25 rally which subdivides into an Elliott wave – Zigzag correction, this implies the move up is just a pause in the 02/19/25 to 03/13/25 decline.
All the subsequent moves up and down have been in three-waves which implies they are parts of a still developing complex corrective pattern. Currently there are several alternate wave counts. Presumably the post 03/13/25 Elliott wave pattern could be more definitive in the next one to three trading days.
Watch the SPX 5,750 area, it could be powerful resistance!
