On 02/28/25 the S&P 500 (SPX) appears to have completed an Elliott – Impulse wave from the all-time high made on 02/19/25. If so, this could be the first wave of a developing bear market that could continue for months.
The SPX 15 – minute chart courtesy of Trading View illustrates the action.

An interesting aspect of the structure is the presumed Sub Minuette “iii” of Minuette (iii). This is the center of the wave count, and it corresponds to the maximum oversold readings on the 15 – minute RSI and MACD – Histogram.
The subsequent rally was an Elliott wave – Horizontal Triangle – the presumed Minuette wave (iv). Also note the subsequent decline sub divided into five waves.
At the 02/28/25 bottom both RSI and MACD had significant bullish divergences, what followed was a strong rally. Please note that the MACD – Histogram at the end of the 02/28/25 session was the highest reading since the 02/19/25 price peak. This is bullish and implies more SPX upside action.
The rally from the 02/28/25 bottom is probably Minute wave [ii]. Wave “twos” typically retrace .618 of wave “ones”. In this case SPX could reach 6,030 to 6,040 in the next one or two trading days.
The daily SPX chart examines the recent drop in context with the longer-term view.
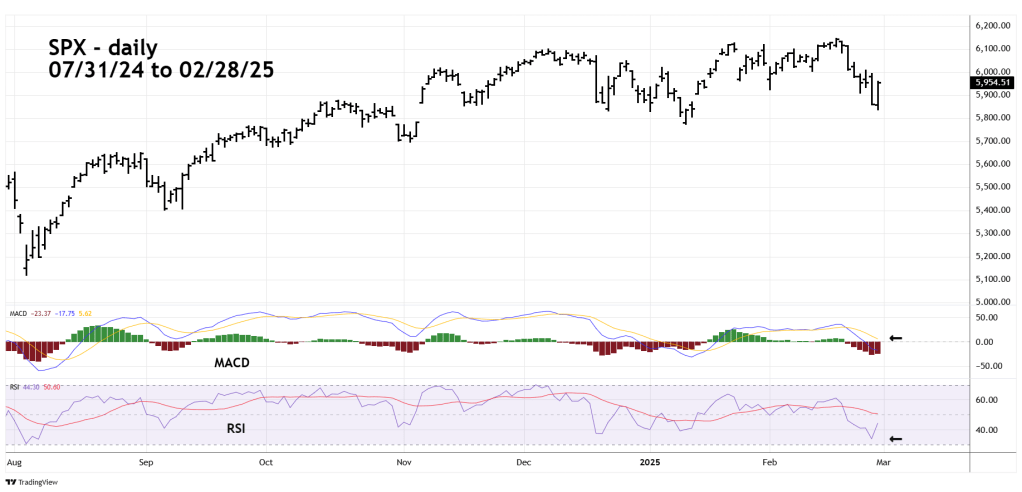
The daily RSI has not reached the oversold zone which begins at 30.00 and only one line of the MACD has gone below the “zero” level. Both readings imply more downside action soon.
The 02/27/25 blog “Downside Breakthrough – 02/27/25” noted the SPX could find support in the 5,700 are during the week of 03/03/25 to 03/07/25. If the rally that began on 02/28/25 continues for one or two trading days, it could extend the next SPX decline further into March and lower than 5,700.
Depending on market action a subsequent blog will examine other price/time bottom targets.
