On 02/28/25 the short – term momentum for the S&P 500 (SPX) was bullish suggesting a rally of at least one trading day – it lasted three – minutes.
The SPX 15 – minute chart courtesy of trading view updates the short – term action.
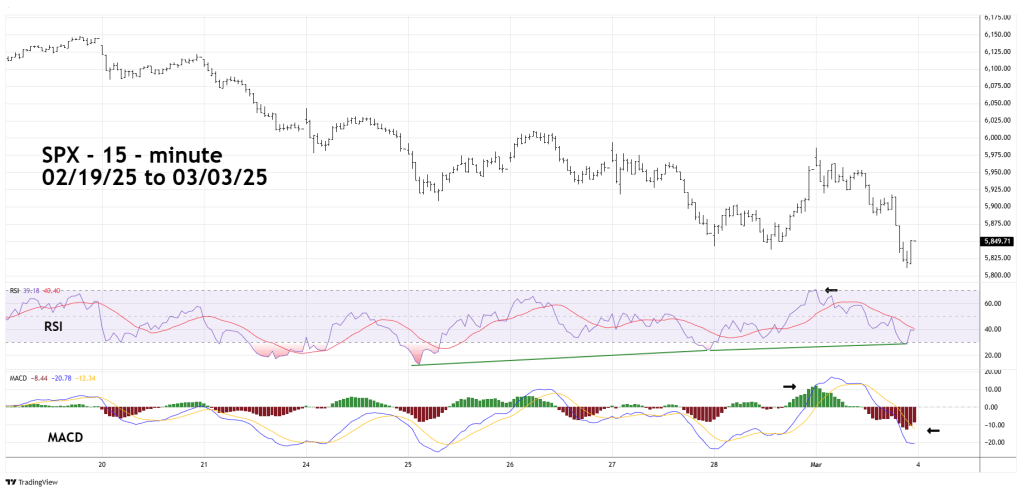
The SPX made its 03/03/25 intraday high three – minutes after the opening of the session. Please note that 15 – minute RSI and MACD high points corresponded with the price peak. Normally this type of action is the indication of higher prices, today it was the exception as later in the session the SPX went below its 02/28/25 bottom.
Sharp powerful up moves that cannot be sustained are typical of bear market rallies.
Momentum readings at the sessions low were mixed. RSI now has a double bullish divergence. However, MACD has no bullish divergence which implies more downside action.
The daily SPX chart illustrates the larger picture.
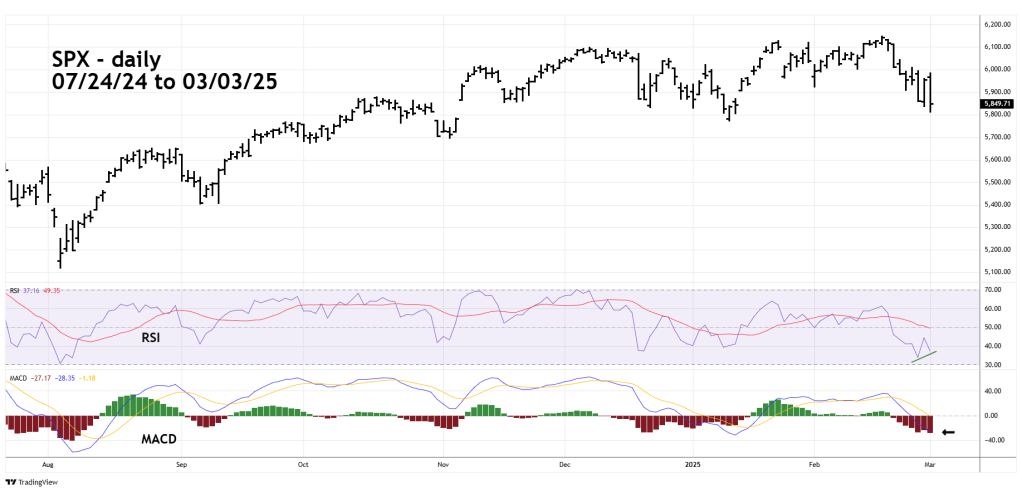
Daily momentum is also mixed. RSI has a bullish divergence while MACD – Histogram is at its deepest oversold point and both lines are now below the “zero” level.
So far, the SPX move below its 02/28/25 bottom is marginal. The SPX could still reach the 6,030 area, the 03.03/25 low could be the “B” wave of an Expanding Flat correction. If so wave “C” could peak somewhere near 6,030.
In the very near – term if the SPX goes below its 03/03/25 bottom, watch the daily RSI.
In powerful moves up or down RSI bullish divergences are blown away. If the current daily SPX – RSI bullish divergence is erased, it could mean the SPX is only in the middle of a deep decline.
