There are two ways to analyze markets and stocks, Fundamental and Technical.
Technical analysis involves the study of price, and broadly the examination of momentum, sentiment and time. Because markets and stocks discount the future, they usually move six to nine months before the fundamentals.
Fundamental analysis for markets examines factors such as employment, inflation, and government/consumer spending. For stocks the focus is on company earnings, product, and debt.
Fundament analysis requires much more work than Technical analysis. The following is a very broad-based examination of the current U.S. economy and simply speculates on cause and effect.
An increase in national governmental spending stimulates the economy and stock markets. The massive U.S. government spending increase in the wake of the 2020 Covid pandemic triggered a massive bull market for U.S. stocks.
Presumably a large decrease in government spending could have an adverse effect on the economy and the stock market.
Currently the U.S. Federal government is undergoing the largest ever civilian reduction in force. It’s estimated that by the end of the U.S. government fiscal year – 09/30/25 the federal work force could be reduced by as much as 7%.
There have been prior large U.S. federal reductions in force, these have been with military personal after the conclusion of major wars. The biggest U.S. military reduction in force occurred after the Second World War. After that conflict the then massive U.S. military was drastically reduced. This reduction did not have an adverse effect on the U.S. economy because its global economic competitors suffered much more during the war. U.S. allies were in bad shape, Japan and Germany were devastated. For about a decade after the war the U.S. dominated the global economy.
Things are different now. It could take months for many for the laid off/fired U.S. government workers to find new employment. As a side note most U.S. government jobs pay much more than their private sector counter parts.
The daily S&P 500 (SPX) chart courtesy of Trading View shows what could happen.
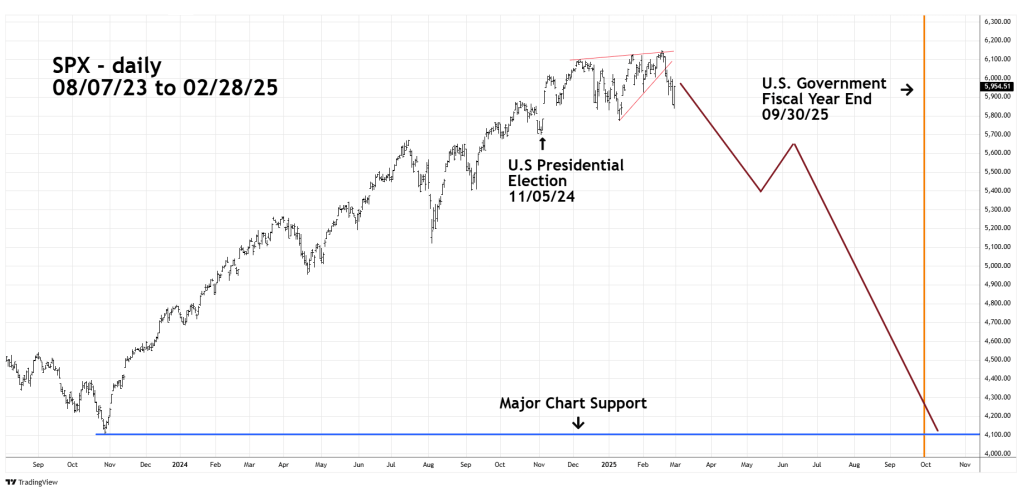
The U.S. fiscal year ends 09/30/25 which corresponds with seasonal U.S. stock market bottoms in October. The federal reduction in force has just begun and is likely to continue for several months. The cost reductions may not be limited to personnel. For example, President Trump has ordered the U.S. Treasury to cease production of the U.S. One Cent coin. It costs three cents to make this coin – which makes no sense.
The big cost savings could come from the yet to be audited Defense Department.
Its possible Defense contractors are making weapons systems that are no longer needed. Also, there could be savings by eliminating overly complex equipment/weapons.
The daily chart of General Dynamic Corp. (GD) illustrates the recent stock action of an important U.S. defense contractor.

In sales GD is the fifth largest U.S defense contractor. Please note that GD peaked just after the 11/05/24 – U.S. presidential election. Subsequently it has retraced more than 61% of its rally since May 2023. Correspondingly SPX has retraced only about 14% of its bull move since 2023.
GD could be leading the way down in a multi-month U.S. stock market decline.
Short – term bullish daily RSI and MACD divergences indicate a counter trend rally could be underway. It’s possible this move could provide another opportunity to sell or sell short GD.
The U.S. federal reduction in force could cause short- term pain for the U.S. economy and stock market during 2025. There could be a long – term gain if the cost reductions result in lower U.S income tax rates.
An increase in U.S. consumer after tax income could trigger a multi-year economic boom.
