On 02/19/25 the S&P 500 (SPX) made an all-time high unconfirmed by the other two main U.S. stock indices – Dow Jones Industrial Average and Nasdaq Composite. This was the five – year anniversary of the SPX – all-time high just before the 2020 – Covid crash.
On 02/20/25 intraday the SPX had declined 1% from its 02/19/25 closing session price.
On 02/21/25 intraday the SPX had declined 1.60% from its 02/20/20/25 closing session price.
There’s a high probability the SPX could have a very sharp drop in the next five to ten trading days. Elliott wave theory gives us a clue to a short – term downside target.
The SPX 3 – hour chart courtesy of Trading View illustrates the action since July 2024.
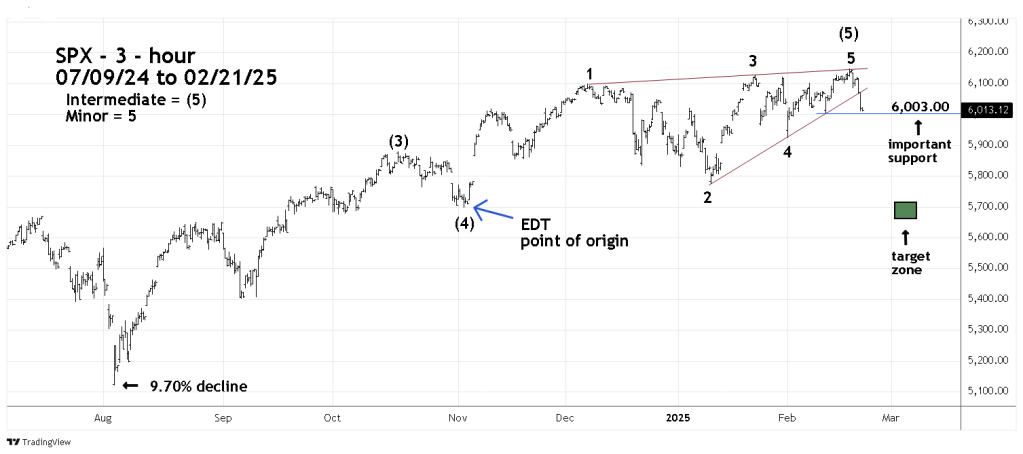
The SPX may have formed an Elliott wave – Ending Diagonal Triangle (EDT) from 11/04/24 to 02/19/25. EDT’s are termination patterns of a larger degree trend. After completion of an EDT there’s usually a rapid retracement back to the pattern point of origin. In this case it’s the bottom made on 11/04/24 at 5,696.51.
The 02/16/25 blog “Bearish U.S. Stock Market Divergences – 02/14/25” illustrated a bearish warning line connecting the bottoms made on 01/13/25, 02/03/25, and 02/12/25. On 02/21/25 the SPX broke decisively below this line. The SPX low on 02/21/25 was 6,008.56 just above important support at 6,003.00. A move below 6,003.00 will break the series of rising bottoms and the short-term bull trend from 01/13/25.
A break below 6,003.00 could also open the door for a move down to the 5,700 area.
The July 2024 to August 2024 mini – crash could be a template for what could happen in the next two weeks.
From 07/16/24 to 08/05/24 the SPX dropped 9.7% in 14 – trading days. A drop from the SPX 02/19/25 top to the 5,700 area is about 7.2%.
The distance to the 5,700-target area is less than 9.7% , if the SPX does decline it could make a bottom in less than 14 – trading days, perhaps 10 – trading days?.
The week of 03/03/25 to 03/07/25 is the time zone for the SPX 5,700 price target.

Greetings Mark,
On the Feb 22nd blog, it mentioned if the SPX exceeds 6003, then 5700 is the target.
I noticed a bearish flag pattern that may take it down to 5450?
Mike
[image: image.png]
LikeLike
Hi Mike
Yes in the next few trading days the SPX could reach 5450.
The prior daily RSI bullish divergence was broken, this is bearish.
On 03/06/25 there’s a tiny daily RSI bullish divergence.
Given that the prior divergence was larger it would not be surprising if the current tiny divergence is also broken.
Most importantly daily RSI still has not reached the oversold zone.
There’s a high probability of more downside action very soon.
Mark
LikeLike