The hourly Dow Jones Industrial Average (DJI) and S&P 500 (SPX) chart courtesy of Trading View shows their recent action.
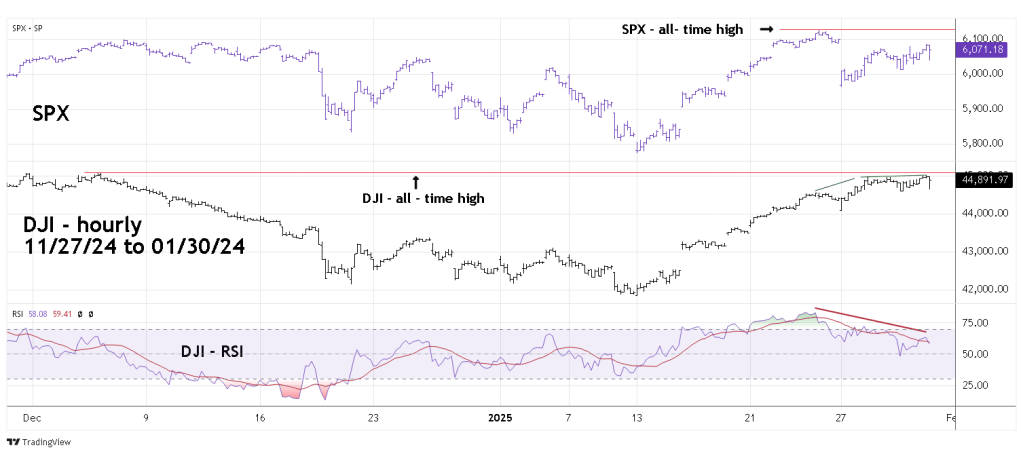
On 01/24/25 SPX made its all-time high unconfirmed by the DJI, and Nasdaq Composite – a potentially very bearish momentum signal. Subsequently on 01/27/25 there was a micro crash in Tech stocks which the DJI has completely retraced.
Prior to 01/27/25 DJI was the upside lagger, now its leading the main U.S. stock indices higher. It looks like the DJI could soon make a new all-time high. However, at its 01/30/25 peak there was a significant RSI double bearish divergence.
The one – minute SPX chart illustrates additional bearish evidence.

Late in the SPX session there was a very steep and quick decline. Please note it took the form of a clear Elliott wave impulse pattern. This could be the first wave down of a larger developing bear trend.
On 01/31/25 watch for a break below the SPX late 01/30/25 session bottom made at 6,039.32 A break below this micro crash low could be a very significant bearish signal.
