The 01/23/25 blog “Watch the Nasdaq Composite – 01/23/25” noted , “If on 01/24/25 IXIC exceeds 20,070.08 and stays below its all-time high of 20,204.50 an important secondary peak could be reached”.
The hourly Nasdaq Composite chart -Trading View symbol (IXIC) shows what happened.

IXIC exceeded the presumed Minor wave “A” of an Elliott wave – Expanding Flat correction and stayed below the all- time high at 20,204.50.
Supporting the theory that an important secondary peak may have been made is the significant RSI bearish divergence vs. the 01/22/25 top.
The daily Nasdaq Composite chart – BigCharts.com symbol (COMP) provides additional evidence an important top may have been made on 01/24/25.
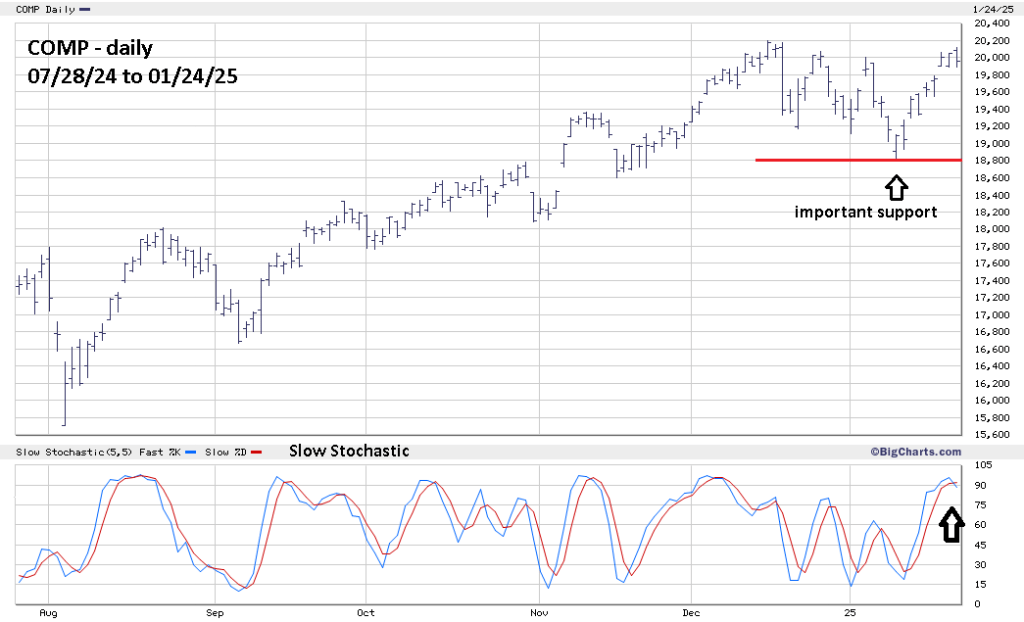
The BigCharts.com Slow Stochastic indicator is very effective identifying potential trend changes. On 01/24/25 with both line in the overbought zone above 80.00 there was a bearish lines cross.
Could this forecast be wrong? Of course, for market analysis we live in a world of probabilities not certainty. The best aspect of Elliott wave theory is that it can tell you exactly where a forecast is wrong. In this case if the Nasdaq Composite reaches its all-time high at 20,204.50 the Expanding Flat wave count is wrong.
