Long-term momentum and sentiment readings for U.S. stocks suggests a major peak is forming.
On 01/24/25 the S&P 500 (SPX) continued its recent pattern of making a new all-time high unconfirmed by the other two main U.S. stock indices, Dow Jones Industrial Average and Nasdaq Composite. This significant bearish divergence is just one factor in the case for a major U.S. stock market top.
The monthly (SPX) chart courtesy of Trading View illustrates its Elliott wave count since the major bottom made in March 2009.
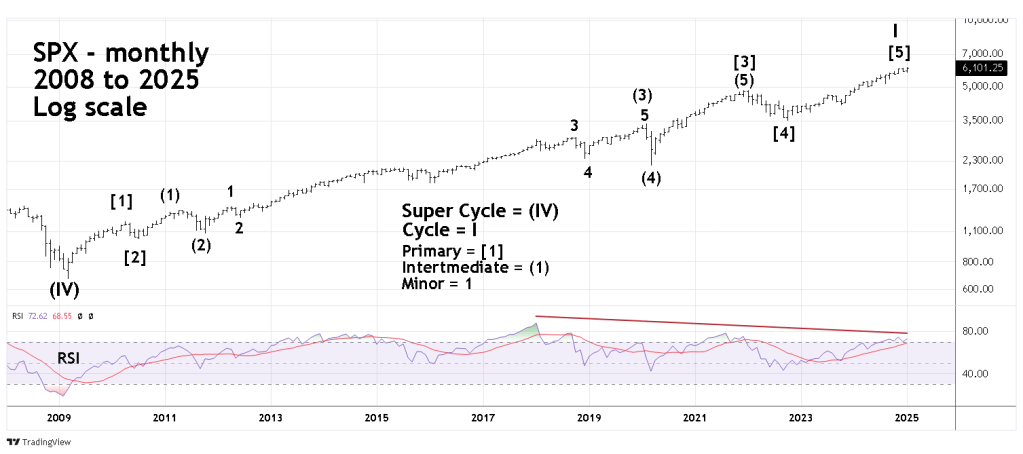
The SPX on 01/24/25 may have completed a Cycle degree Impulse wave that began in March 2009. In Elliott wave theory, subsequent corrections to Impulse patterns are proportional in time and price. The next SPX bear market could continue for several years.
Note the multiple RSI bearish divergences since the momentum peak in early 2018. Also note that the most recent monthly RSI reading is in the overbought zone which begins at 70.00. A bearish divergence within the overbought zone implies there’s plenty of room for subsequent downside action.
The weekly SPX chart examines the action from the October 2022 bottom.

While the time scale between the weekly and monthly charts is about 2 – years vs. 15 – years the general form of both patterns is very similar. Also note the phenomenon of multiple RSI bearish divergences is very similar.
The daily SPX chart zooms in on recent action.

The January 2025 SPX peak has bearish divergence vs. the December 2024 top. This phenomenon continues down to the hourly scale. The SPX 01/24/25 hourly high had a bearish RSI divergence vs. the 01/22/25 hourly peak.
The weekly VIX and SPX chart examines evidence from the Sentiment dimension.

The SPX – volatility index (VIX) is very effective in identifying SPX bottoms. Note the VIX spike up during the August 2024 SPX mini crash.
The VIX action during SPX tops is different. The VIX does not spikes down, it forms higher bottoms. The VIX is derived from Put and Call options. As the SPX rises some traders are wary of an SPX decline, hedging with Put options. The increase in Put options moves the VIX higher.
On 01/24/25, with the SPX above its December 2024 high had higher corresponding VIX bottom.
Normally this phenomenon only occurs once before the SPX declines by at least 20%. This most recent VIX divergence is the third in less than one year! Could this third divergence be another VIX fake out, or part of a super bearish triple VIX signal? We may have an answer in a few weeks.
The next weekly SPX chart shows sentiment readings from Market Vane Bullish Consensus.

The Bullish Consensus measures the futures market sentiment each week by following the trading recommendations of leading Commodity Trading Advisors.
For the SPX readings below 35% indicate a major bottom could be forming. Reading above 65% usually imply a major top.
The SPX Bullish Consensus has been over 65% for almost a year! This could mean the SPX is like an overripe fruit ready to drop.
Please note the most recent reading of 70% came before SPX made a new all-time high. The next reading will be out early next week. What ever the reading the message is the same , the SPX is highly vulnerable for a multi – month decline of at least 20%.
These are the important factors for early 2025.
Only one of the three main U.S. stock indices is making a new all-time high.
On multiple time frames the SPX- RSI has bearish divergences.
For almost a year VIX and Bullish Consensus have had bearish readings.
These are not the ingredients for a multi – month bull run. The most likely direction for U.S. stocks in the next several months is down.
