The 12/24/24 blog “Fascinating Elliott Wave Patterns – 12/24/24” noted.
“The sharp rally on 12/20/24 could be the “a” wave of an Elliott wave – Single Zigzag. If so, there’s a good chance for the SPX to rally beyond its 12/19/24 high sometime on 12/23/24 or 12/24/24.”
The wave “c” of a presumed Elliott Wave – Single Zigzag may have terminated on 12/26/24.
The 30 – minute S&P 500 (SPX) chart courtesy of Trading View updates the intraday action.
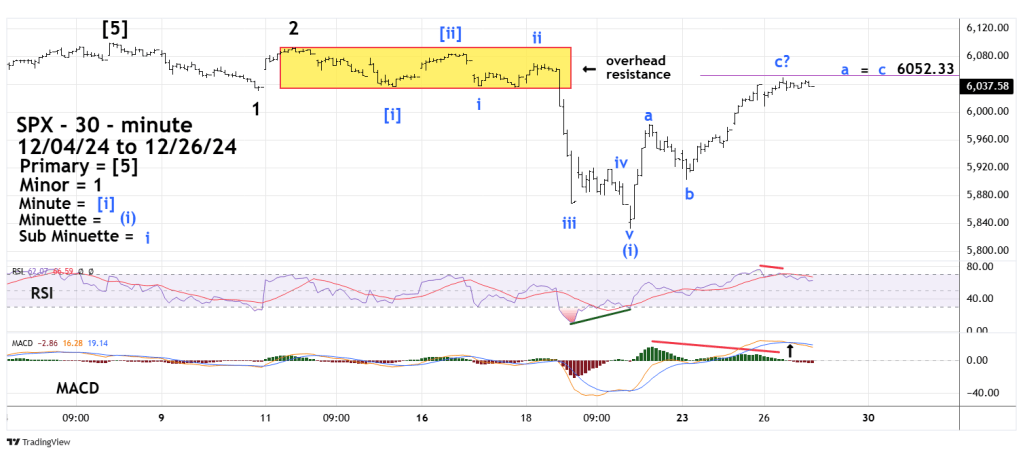
The SPX high on 12/26/24 was 6,049.75. Typically, within a Single Zigzag wave “a” equals wave “c”, in this case the level is 6,052.33.
The SPX 12/26/24 high was also in the middle of overhead resistance.
RSI at the intraday top had a bearish divergence. MACD – Histogram had a bearish divergence and a bearish lines cross.
Based on Fibonacci and momentum evidence the SPX may have made an important secondary peak on 12/26/24.
A break below the presumed Sub Minuette wave “b” at 5,901.10 could open the door for a move down to the 12/20/24 bottom.
