On 10/11/90 the S&P 500 (SPX) ended a three-month 21% decline.
Seventeen – years later on 10/11/07 the SPX completed a five-year bull market.
Seventeen years after the 2007 peak and a Fibonacci thirty – four years after the 1990 bottom the SPX may complete a two-year bull market.
The monthly SPX chart courtesy of Trading View shows the long-term picture.
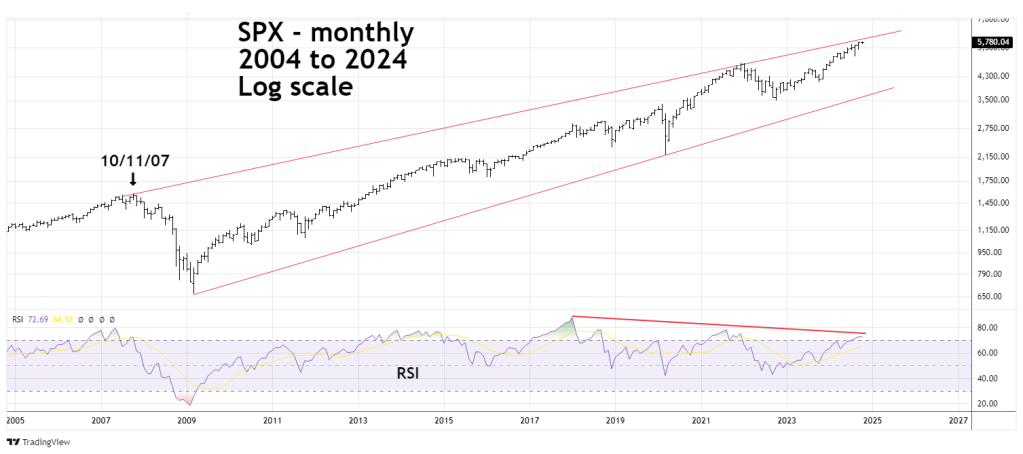
Monthly RSI is in the overbought zone – above 70.00 with a double bearish divergence vs. the January 2018 momentum peak.
The daily SPX chart courtesy of BigCharts.com examines intermediate – term momentum.
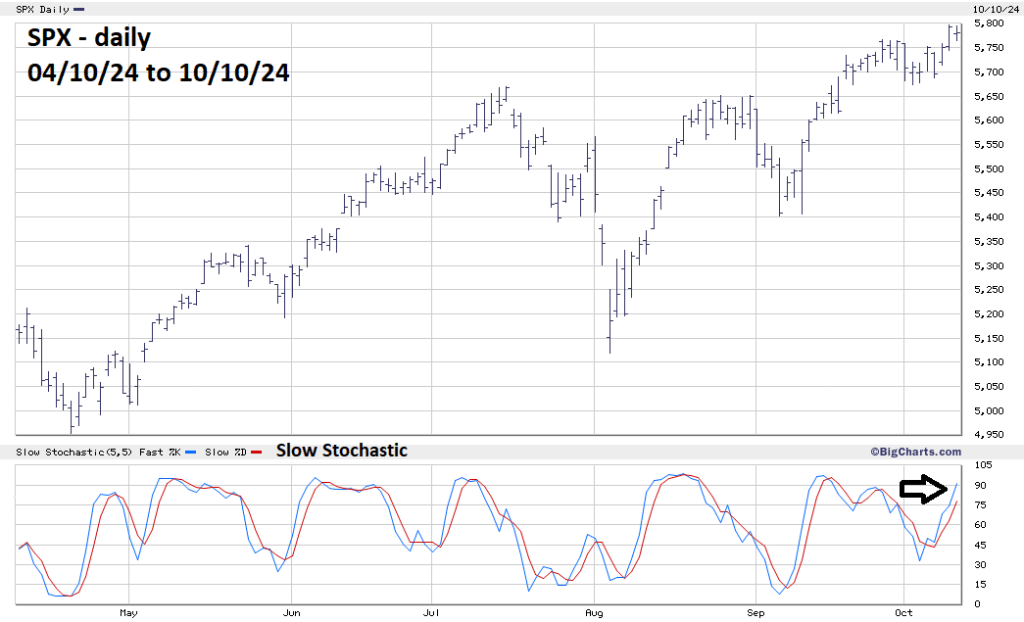
Both lines of the Slow Stochastic have reached the overbought zone above 80.00.
There’s short-term Fibonacci resistance in the low 5,800 area. 5,803 is the bullseye number. The SPX could reach this level in the first hour of trading of the main session on 10/11//24.
Happy Anniversary!
