Crude Oil is seasonally bearish into December, the current decline could continue for several weeks.
The weekly Crude Oil – continuous next contract chart (CL2!) courtesy of Trading View illustrates the long – term view.
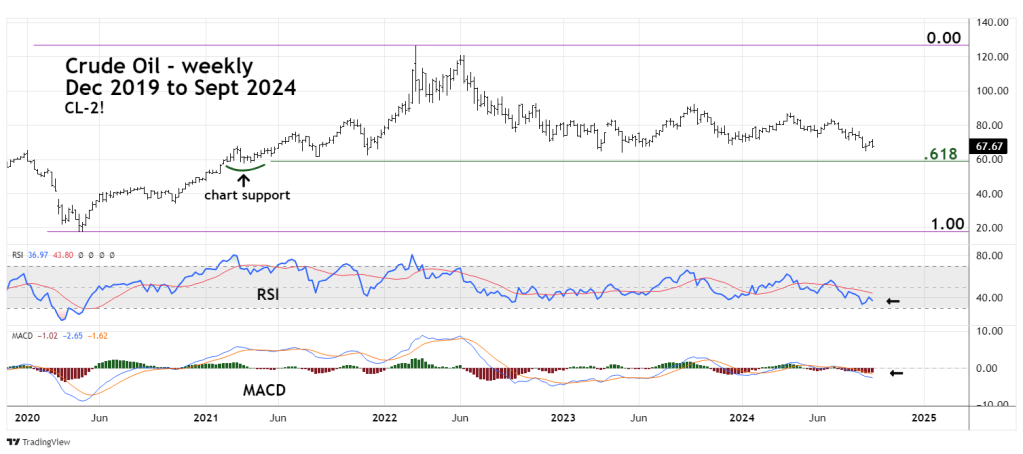
Crude Oil could be drawn down to a Fibonacci .618 retracement of the April 2020 to March 2022 bull market. Just below this level is a price cluster made in early 2021 in the area of 57.00 to 60.00.
Weekly RSI has yet to reach the oversold zone which begins at 30.00. Currently its at 36.97.
Weekly MACD lines continue to trend down and so far there’s no significant bullish divergence on the MACD – Histogram.
The monthly Crude Oil chart courtesy of Barchart.com shows the Commitment of Traders (COT) report.

The Commitment of Traders report breaks the traders into three groups, Small Speculators, Large Speculators, and Commercials. The Commercials are the group to follow. They hold the most contracts and have the most knowledge about the commodity.
For Crude Oil the Commercials almost always have a net short position to hedge against price declines. The most recent report has the Commercials holding the smallest net short position since the bottom made in late 2015 to early 2016. COT is not a precise timing indicator. Turns may not occur for several weeks.
Seasonal patterns and momentum suggests an important bottom could be made between November 2024 to January 2025 in the area of 57.00 to 60.00.
