Gold in U.S. dollars could soon make a significant peak.
The 08/25/24 blog “Gold Update – 08/23/24 noted.
“If Gold can move above its current all-time high set on 08/20/24 the rally may not last very long or go very high.”
On 09/05/24 Gold in U.S. dollars (XAUUSD) appears to be poised to move above its 08/20/24 high.
The weekly Gold chart courtesy of Trading View updates the long – term action.
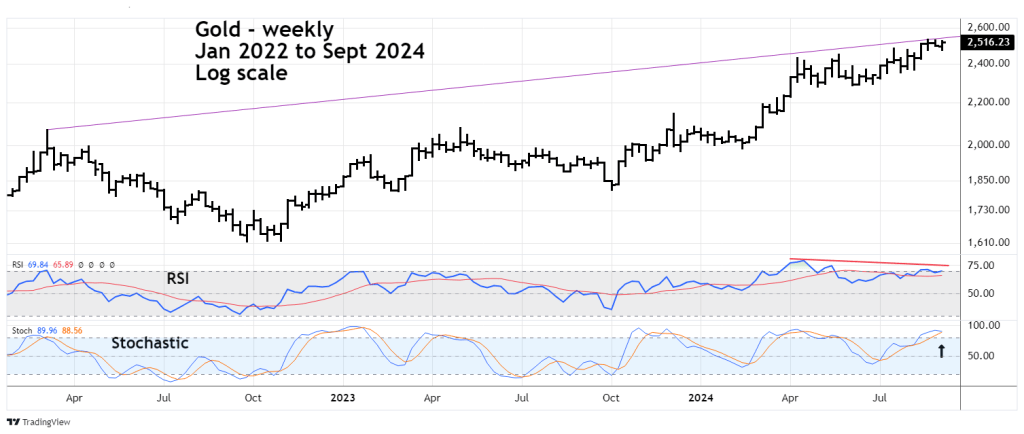
Gold is close to the rising trendline connecting the peaks made in March 2022 and August 2024. RSI still has a significant bearish divergence and Stochastic is on the verge of a bearish line cross.
The daily Gold chart zooms in on what’s happened since March 2024.
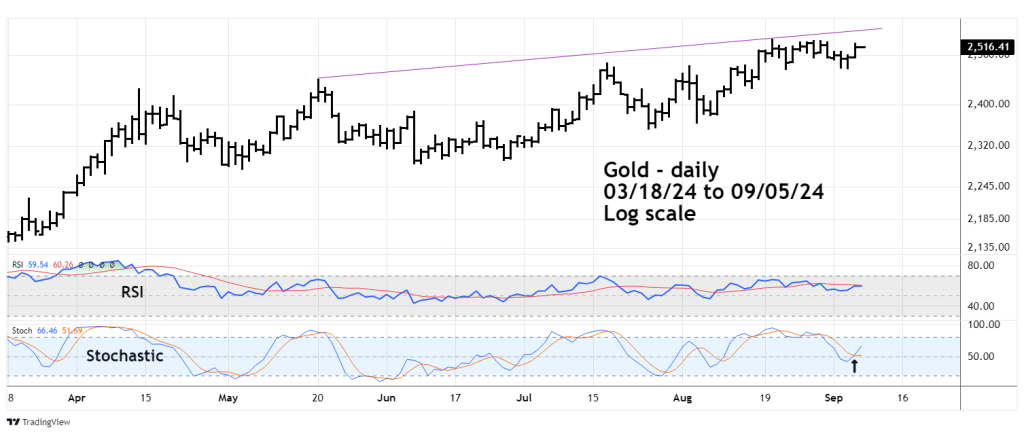
Daily Gold is close to hitting a shorter term trendline connecting the 04/12/24 and 08/20/24 tops.
Daily Stochastic has a bullish lines cross which implies at least a one to three trading day rally.
The weekly Gold Futures chart courtesy of Barchart.com illustrates the Commitment of Traders (COT) report.
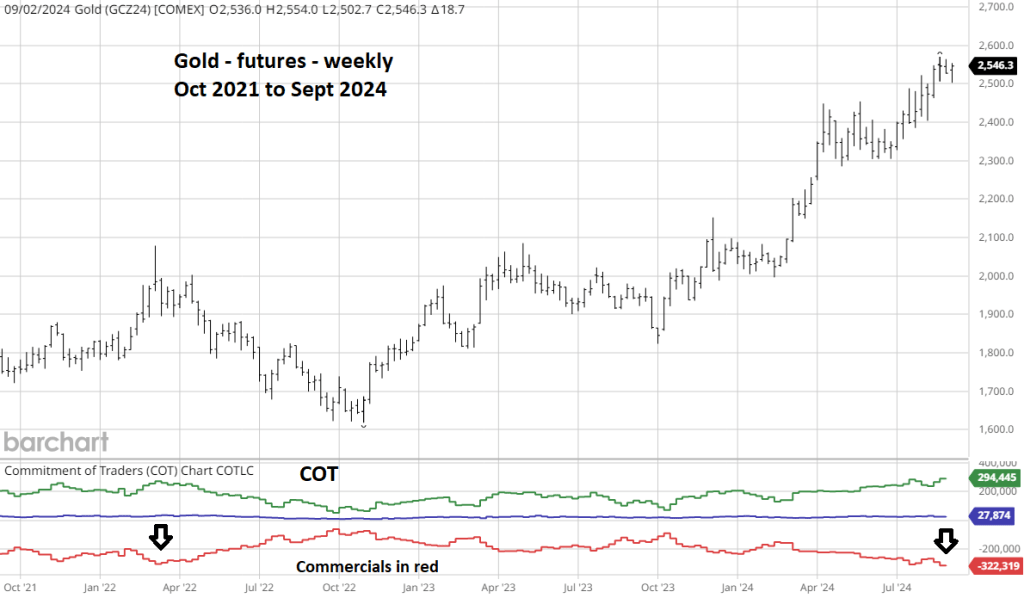
The weekly COT report tracks the Gold Futures positions of three groups, large Speculators, Small Speculators, and Commercials. The group to follow are Commercials, they hold the most Futures contracts.
Commercials now have a larger net short position than they held at the March 2022 peak. After March 2022 top Gold declined 21%.
Gold in U.S. dollars could soon make a new all – time high in the area of 2,540 to 2,550.
