The Dow Jones Industrial Average (DJI) has reached potentially strong resistance at a very interesting time.
Labor Day in the U.S. is almost like the start of a new year. Summer vacations end, most schools resume, and sometimes stocks market bears come out of hibernation.
There have been two very significant U.S. stock market declines shortly after Labor Day.
The daily DJI chart courtesy of Trading View illustrates the first which occurred after Labor Day – September 1929.

The ultimate peak of a spectacular eight – year bull market happened on 09/03/29, just after Labor Day. What followed was the September to October 1929 stock market crash.
Sometimes markets can make significant turns on Full/New Moons plus or minus two trading days. There was a New Moon on 09/03/29. Labor Day in 2024 is 09/02/24, the cash U.S. stock market resumes trading 09/03/24 which is also the day of a New Moon.
The next daily DJI chart shows what happened after Labor Day – September 2000.
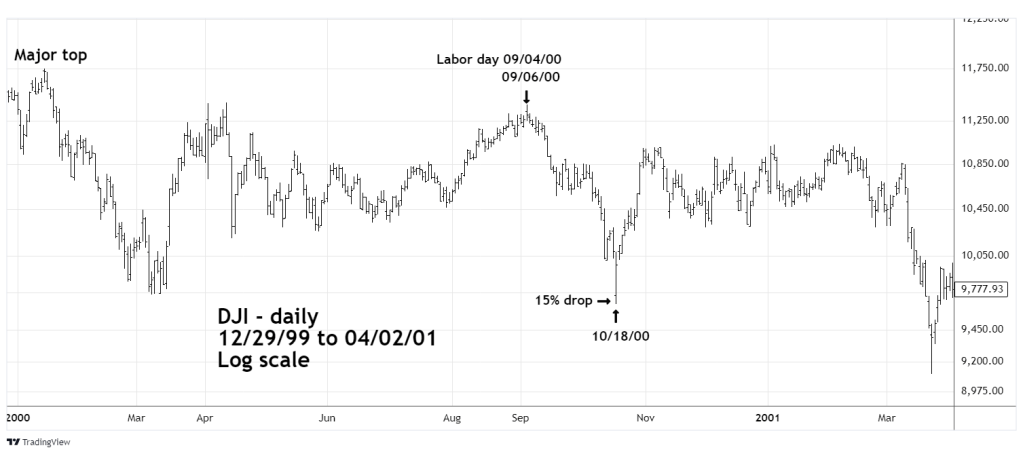
The major top of a massive thirteen-year bull run occurred in mid – January 2000. After a two – month drop, a secondary rally culminated two trading days after Labor Day. Subsequently the DJI declined 15% into mid – October 2000. Later the bear market continued and did not end until October 2002.
The yearly DJI chart illustrates a Fibonacci time relationship of the two Labor Day peaks.
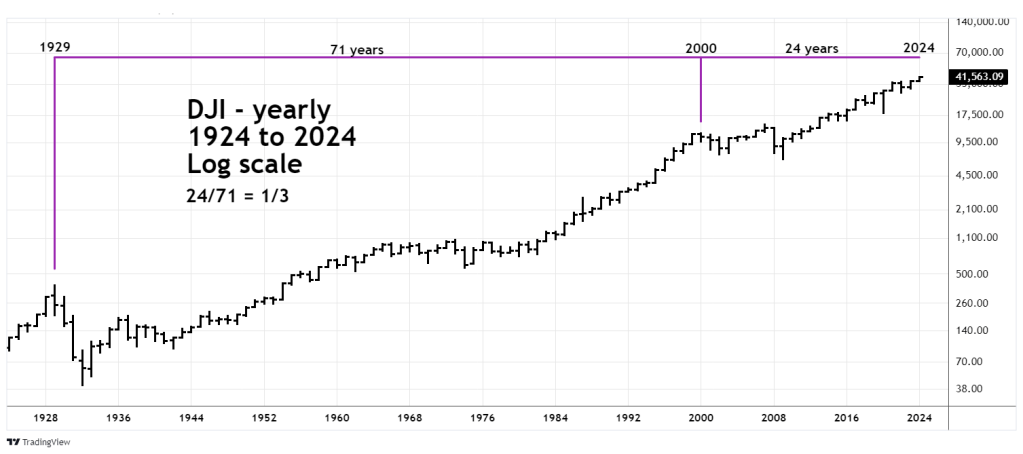
There’s an outlying Fibonacci time relationship 24/71 or 1/3 that targets a potential turn – Labor Day 2024.
The monthly DJI chart examines a Fibonacci price relationship going back to March 2009.

Within Elliott – Motive waves there usually a Fibonacci price relationship between the first and fifth waves. When measuring price moves of large percentage gains its more appropriate to compare growth rates.
Primary wave [1] from March 2009 to April 2010 had a growth rate of 74.00% multiplied by the Fibonacci ratio of .618 equals 45.73%. Adding growth of 45.73% to the Primary wave [4] bottom of 28,660.94 targets 41,767.58 as a potential top for Primary wave [5].
The daily DJI chart shows a Fibonacci price relationship from 2022 to 2024.
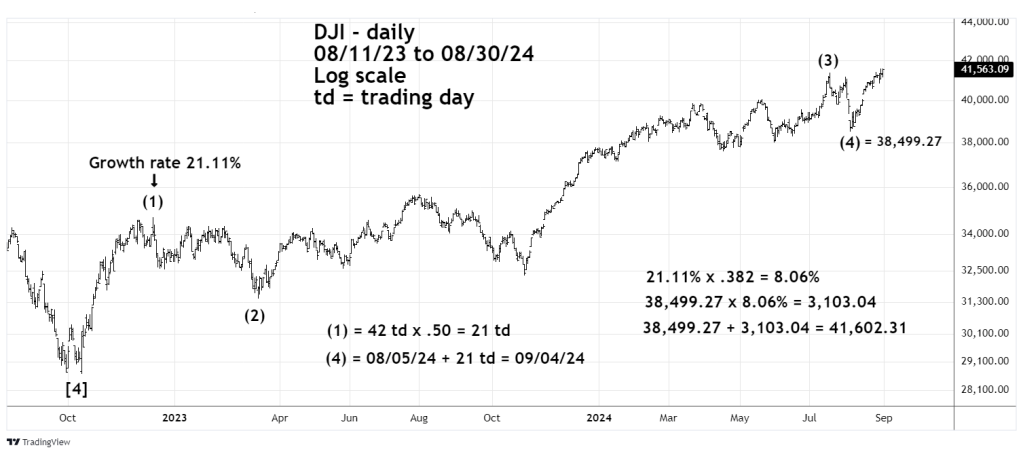
Intermediate wave (1) had a growth rate of 21.11% multiplied by the Fibonacci ratio of .382 equals a growth of 8.06%. Adding growth of 8.06% to the Intermediate wave (4) bottom of 38,499.27 targets 41,602.31.
There’s also a potential Fibonacci time relationship. Intermediate wave (1) was 42 – trading days multiplied by the Fibonacci ratio of .50 equal 21 – trading days. Adding 21 – trading days to the Intermediate wave (4) bottom on 08/05/24 targets 09/04/21 for a time cycle turn.
This is a summary of evidence for a significant DJI top illustrated in this current blog and the 08/31/24 blog.
Fibonacci price targets:
From March 2009 – DJI – 41,767.58
From October 2022 – DJI – 41,602.31
From 08/22/24 – DJI – 41,662.29.
Trendlines:
Daily – December 2022 to July 2024.
Intraday 08/26/24 to 08/29/24.
Time targets:
Labor Day New Moon – 09/03/24.
Yearly outlying Fibonacci time ratio – 1929 – 2000 – 2024.
Daily October 2022 to September 2024.
Happy Labor Day!

Going into historically tough months for the market in an election year with a Candidate talking about unrealized gains. I think a deep market correction is inevitable. The bigger question is where will all that money go?
LikeLike
Cash is the most likely desination for any sold stocks.
LikeLike