Long- and short-term Fibonacci time and price relationships imply an important U.S. 30 – Year Treasury Yield (TYX) bottom could be made late August/early September 2024.
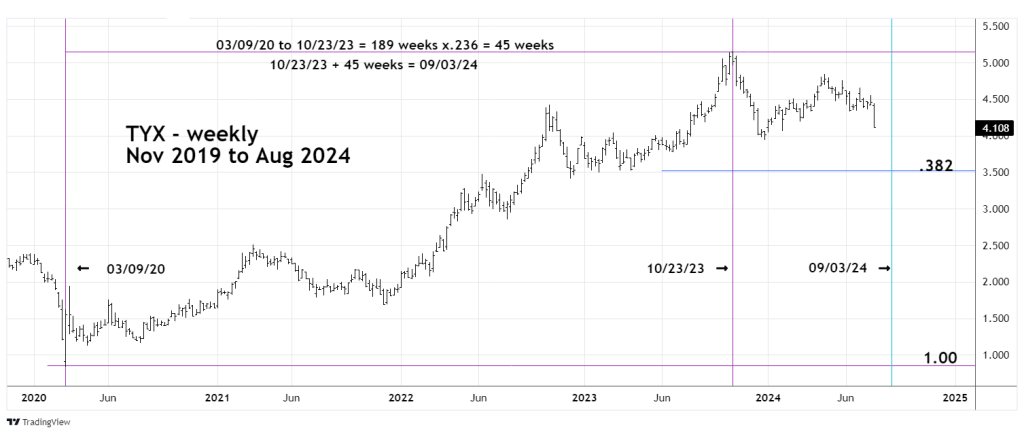
The weekly TYX chart courtesy of Trading View examines the long-term picture.
One of the main aspects of Elliott wave analysis is that corrections of movements are usually in proportion to the prior move up or down. For example, if market “X” rallied from 100 to 200 in one year, perhaps the subsequent correction could retrace half of that progress and bottom somewhere near 150. The same theory can be applied to the time dimension. If market “X” rallied from early January to late December perhaps the subsequent correction bottom could come in late June or early July.
If a market moves into a Fibonacci price/time zone there’s a good chance a turn could develop.
Major Fibonacci support for the TYX move up from 2020 to 2023 is a .382 retracement of the rally, near 3.50.
The TYX 2020 to 2023 rally lasted 189 – weeks multiplied by the Fibonacci ratio of .236 equals 45 – weeks. The major TYX peak was made during the week of 10/23/23. Adding 45 – weeks after this top targets the first week of September 2024 for a possible turn.
If TYX is near the 3.50 area in late August or early September 2024 an important bottom could be developing.
The daily TYX chart focuses on short – term Fibonacci price analysis.
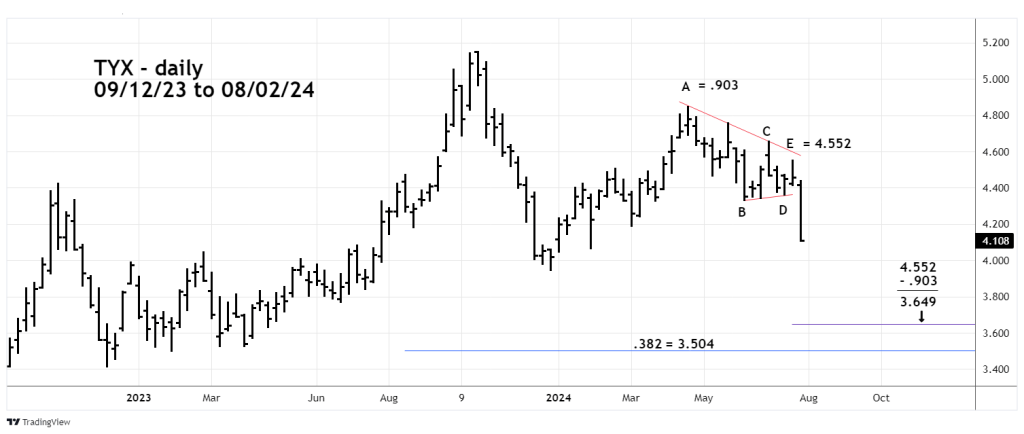
This websites prior blog illustrated that an Elliott wave Inverse Horizontal Triangle probably formed from late December 2023 to July 2024.
After completion of Horizontal Triangles there’s usually a thrust in the direction of the main trend which in this case is down. Many times, the post triangle thrust can be measured by the widest part of the triangle. In this case it’s the presumed Minor wave “A” was .903 points. This amount subtracted from the end point of the Inverse Horizontal Triangle at 4.552 targets a bottom at 3.649. Note this is close to the main Fibonacci coordinate of 3.504, and in the area of price support made in March to April 2023.
The next daily TYX chart zooms in on the short-term Fibonacci time relationships.
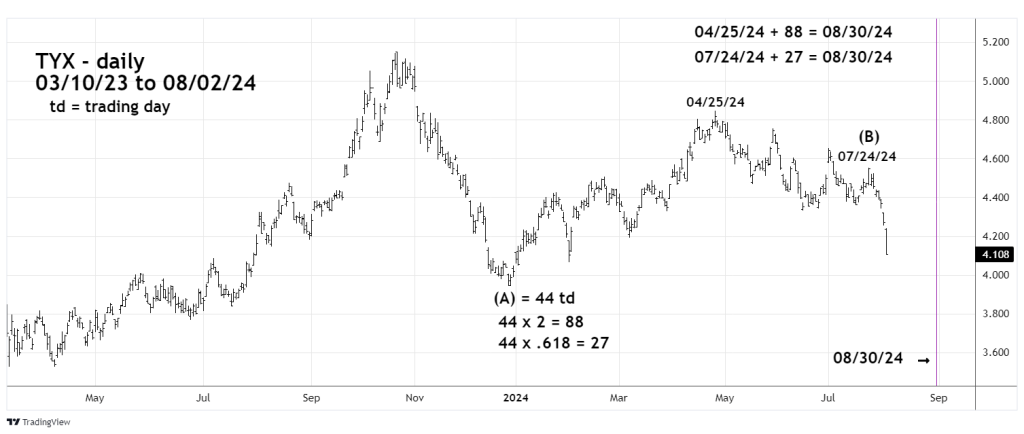
From the major TYX top made in 2023 there could be an Elliott wave – Single Zigzag correction developing. In this structure there’s usually either a Fibonacci price and or time relationship between waves “A” and “C”.
The TYX October to December 2023 is the presumed Intermediate wave (A) of the Single Zigzag. The presumed Intermediate wave (B) as previously noted is a presumed Inverse Horizontal Triangle. In any type of Horizontal Triangle there are two ways to measure post triangle moves. From the high/low point, in this situation with an Inverse Horizontal Triangle it’s the peak made on 04/25/24. The other way is from the end point of the triangle which in this case is the top made on 07/24/24.
The presumed Intermediate wave (A) lasted 44 trading days (td). Multiplying 44 by the Fibonacci sequence number of 2 equals 88 td. Adding 88 td to the 04/25/24 peak targets 08/30/24 as a potential turn date.
Multiplying 44 by the Fibonacci ratio of .618 equals 27 td. Adding 27 td to the 07/24/24 top also targets 08/30/24 for a potential turn date.
If TYX is in the area of 3.40 to 3.70 – late August or early September 2024 an important bottom could develop.
The next U.S. – FOMC interest rate decision will be announced on 09/18/24. Assuming TYX does make a bottom late August/early September, could a double bottom develop on an FOMC rate decision? There are several scenarios that could happen.
Let’s take one forecast at a time. Mark your calendars for a potential TYX bottom in late August or early September 2024. What occurs after then could give us clues to post FOMC 09/18/24 -TYX action.
