Sometimes a market trend can change in as little as a 30 – minute bar. Longer – term changes can come on the cusp of a new year, or perhaps a new month.
U.S. stocks started August 2024 with a vicious downturn.
The daily S&P 500 (SPX) chart courtesy of BigCharts.com shows the action since 04/01/24.
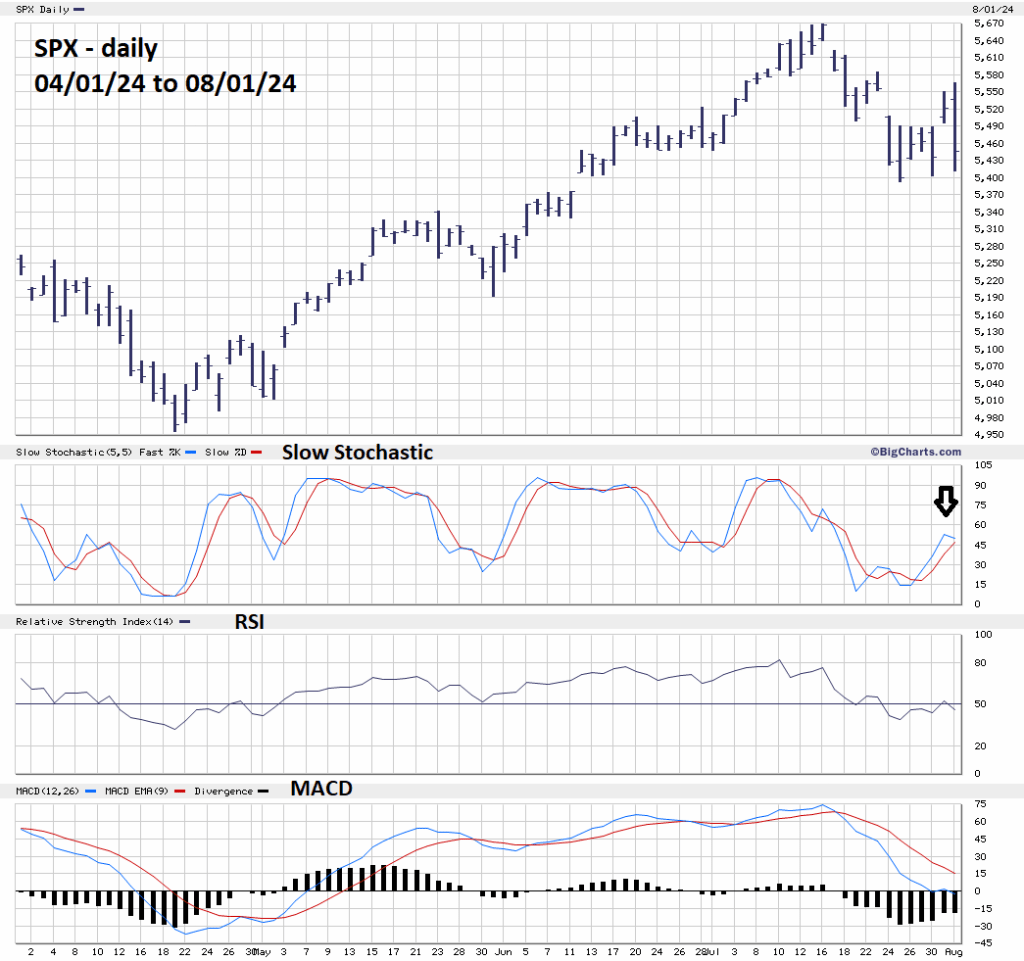
From the perspective of the Market Profile method of market analysis, the sharp steady drop on 08/01/24 was a “Trend Day” This is the most dynamic of market intraday actions in which counter trend moves are very shallow.
Daily momentum indicators imply there could be more downside action in the coming days.
The very effective Slow Stochastic is poised for a bearish lines cross.
The daily RSI is at 45.95 the oversold zone begins at 30.00.
So far only one MACD line has gone below the zero – level.
The SPX could continue declining for at least one week – perhaps longer.
The daily S&P 500 – Emini chart courtesy of Ninja Trader illustrates an important support level.
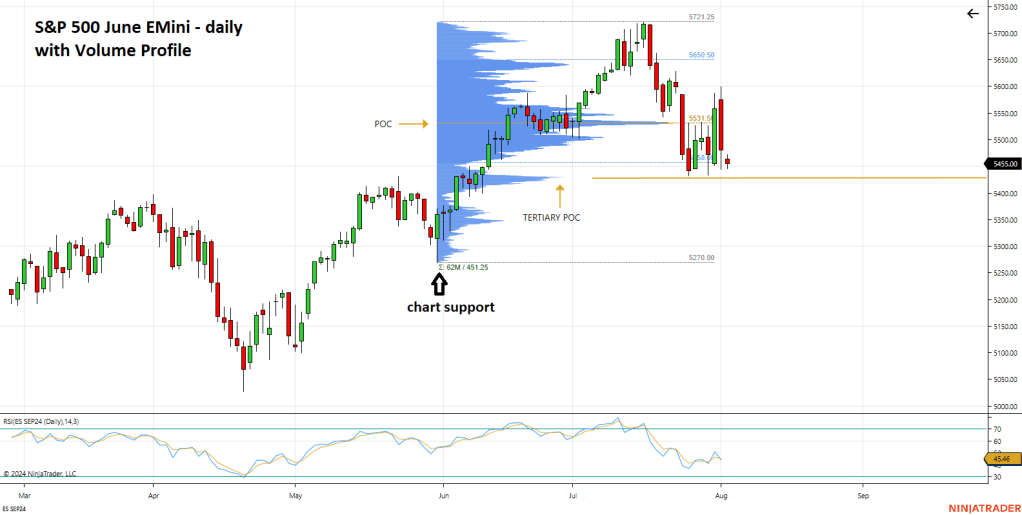
There’s a double bottom just above a tertiary POC level at 5,428.00. A break in this support could trigger a rapid decline to chart support at the 05/31/24 bottom of 5,270.00.
