The Nasdaq 100 (NDX) is at a crossroads. The action on 08/01/24 could determine the near – term course for U.S . stocks.
The daily NDX chart courtesy of Trading View shows the first alternate Elliott wave count.
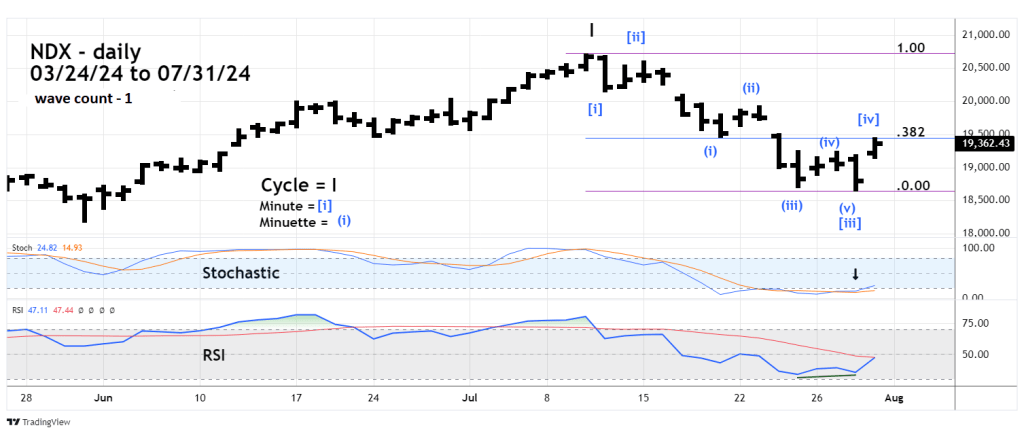
The NDX from its 07/10/24 all-time high has a very clear Elliott wave count. The general form of the move down appears to be an extended Elliott wave Impulse pattern.
If this count is correct the high on 07/31/24 may have completed Minute wave [iv] of the pattern. On 07/31/24 NDX retraced a Fibonacci .382 of the 07/10/24 to 07/30/24 decline. Wave “fours” typically retrace to the Fibonacci .382 area.
On the bullish side of the coin, daily Stochastic has a bullish lines cross. RSI at the 07/30/24 bottom had a bullish divergence.
If this count is correct Minute wave [v] is developing and could soon go below the 07/30/24 bottom.
The next NDX daily chart shows the second alternate Elliott wave count.
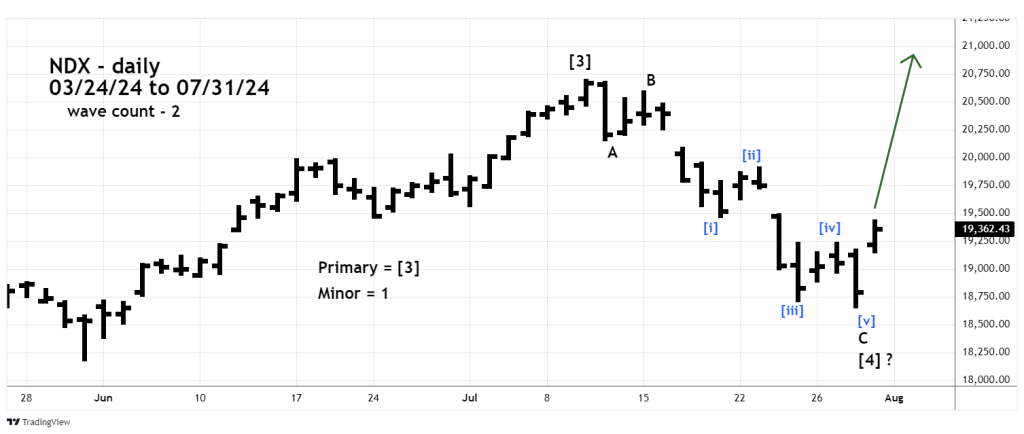
In this configuration NDX has completed a Single Zigzag correction of bull move going into the 07/10/24 peak.
If this wave count is correct the NDX is in a developing move up that could exceed the 07/10/24 peak.
An NDX move above 19,479.38 on 08/01/24 could increase the bullish probabilities.
Traders were stopped out of a 50% short position of non – leverage Russell 2000 funds when the Russell 2000 exceeded its 07/17/24 top. The loss on the half position was 1.85%.
