Four Asian stock markets reveal interesting long-term patterns.
The weekly Vietnan Stock Index (VN30) courtesy of Trading View shows its action since 2021.

The VN30 – November 2021 to November 2022 decline formed an extended Elliott wave Impulse pattern, which implies the first phase of a larger developing bear market. Note that the subsequent bull phase after November 2022 was slower and had deeper counter trend movements. This is the signature of a retracement to the main trend – which in this case is down.
The post November 2022 rally has retraced to near the Fibonacci .618 level – a common end point for counter trend moves.
In the short term VN30 could rally into the first week of July moving marginally above the recent high.
Weekly RSI has a double bearish divergence which implies the next decline could continue for several months. If the Elliott wave pattern from the November 2021 peak is correct the minimum downside target is the November 2022 bottom.
The monthly Shanghai Stock Exchange Composite Index – SSE – Trading View symbol (000001) shows its long-term pattern.
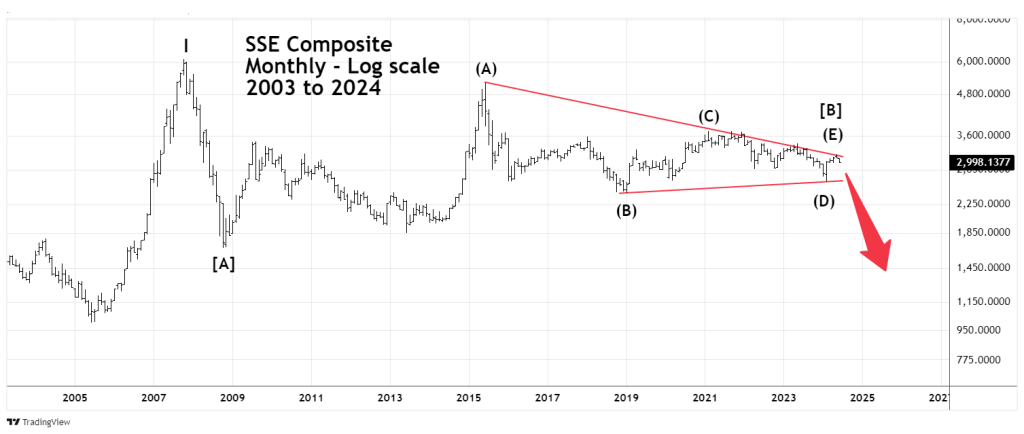
Of the major national stock markets SSE is the most bearish. Not only is it far below the all -time high made in October 2007, its also far below the secondary peak made in June 2015.
The movement from the major bottom made in October 2008 to May 2024 appears to be a completed Elliott wave – Horizontal Triangle. If so this could be one of the largest Horizontal Triangles in history.
If the pattern is complete at the May 2024 peak the SSE could be in a post triangle trust down. The minimum downside target is the October 2008 bottom. Considering the relative weakness of SSE since its October 2007 all-time high, there’s a good chance for a break below the October 2008 bottom.
The weekly Philippines Stock Exchange Index (PSEI) shows what’s happened since its all-time high made in January 2018.

January 2018 to March 2020 is an Elliott three wave correction. Normally with this pattern the subsequent move up would be expected to exceed the January 2018 high. So far what’s happened is a large sideways movement probably an Elliott wave – Horizontal Triangle.
This is a corrective pattern and implies just a pause in the 2018 to 2020 bear market. If the Horizontal Triangle is complete at the April 2024 peak the next decline could reach at least the March 2020 bottom.
Bearish signals to watch.
- A break below the rising trendline connection the October 2022 and October 2023 bottoms.
- A break below the October 2023 bottom.
- A break below the October 2022 bottom.
The area just below the October 2022 bottom is very important.
The October 2022 bottom was at 5,699.29.
The September 2020 short term bottom was at 5,695.77.
The August 2020 short term bottom was at 5,691.74.
There’s very little chart support below this triple bottom. A break below 5,691.74 could trigger a mini crash down to the March 2020 bottom.
The final monthly chart illustrates the incredible history of the Nikkei 225 index (NI225) November 1980 to June 2024.
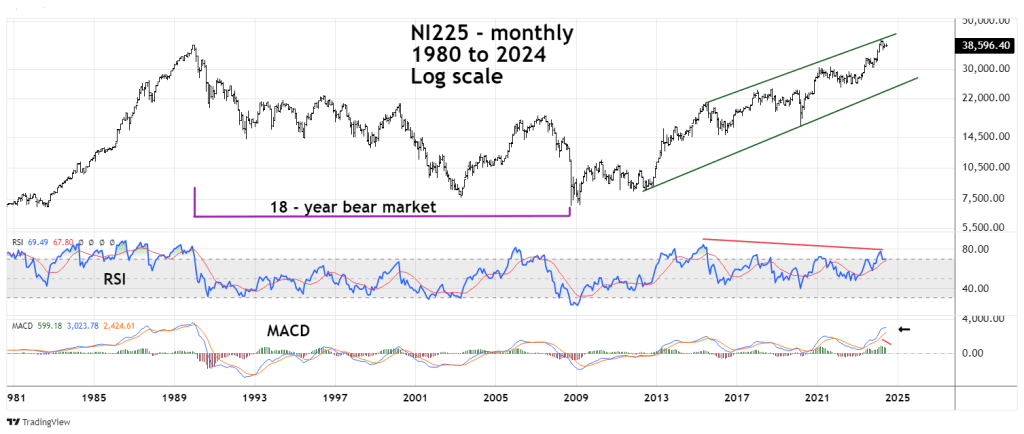
The NI225 made an all-time high on 12/29/89 and then went into a bear market declining 81% in eighteen years!
In the U.S. buy and hold for stocks is a fairly common strategy. It’s a good guess buy, and hold was not popular in Japan after the massive bear market.
After October 2008 the NI225 appears to be in a developing Elliott impulse pattern. The monthly RSI has a bearish divergence implying a correction may have begun at the March 2024 peak. If a correction has begun it could decline 20 to 25% from the March 2024 top.
From January 1990 to October 2008 the NI225 was the most bearish national stock index. Perhaps in the coming years it could be the most bullish.
