On 06/20/24 both Nvidia Corporation (NVDA) and the Nasdaq Composite had Key Reversal days.
A key reversal does not occur very often but is very reliable when it does.
After an up-trend:
The Open must be above yesterday’s Close,
The day must make a new High, and
The Close must be below yesterday’s Low.
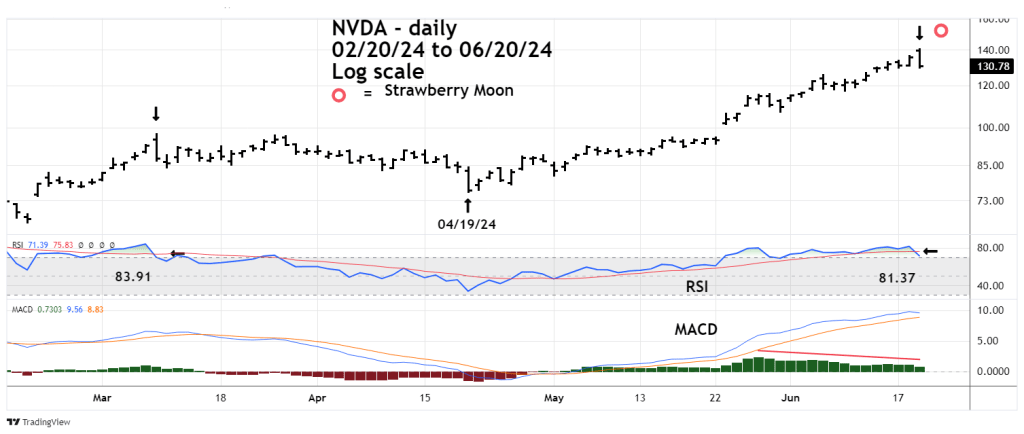
The last time both NVDA and the Nasdaq Composite had Key Reversals was on 03/08/24. For NVDA the 03/08/24 signal was the beginning of a decline that bottomed out on 04/19/24 – the same day of the Nasdaq Composite correction low.
The daily NVDA chart courtesy of Trading View illustrates the action.
NVDA is the king of U.S. stocks. Its manic rally has greatly contributed to the persistent move up of the main U.S. stock indices. If NVDA peaked on 06/20/24 it could be a bearish signal for most U.S. stocks.
Also, the key reversal occurred two days before a Full Moon on 06/22/24. Sometimes markets or stocks can make turns within two trading days plus or minus of a New/Full Moon.
The June – Full Moon is called the “Strawberry Moon” to match the short harvest season for Strawberries’.
Daily RSI had a bearish cross of its moving average, which also happened on 03/08/24.
Daily RSI reading on 06/18/24 was 81.37.
Daily RSI reading on 03/08/24 was 83.91.
MACD – Histogram has been declining since 05/29/24.
In business the term “being in the red” means losses.
In Technical Analysis – red is frequently used to designate down movements.
The Strawberry Moon could be heralding a multi – month U.S. stock market decline.
