On 06/12/24 the S&P 500 (SPX) and the Nasdaq Composite(IXIC) made new all-time highs. How can the U.S. stock market be shrinking? The answer is illustrated in the Nasdaq new highs chart courtesy of Barchart.com.
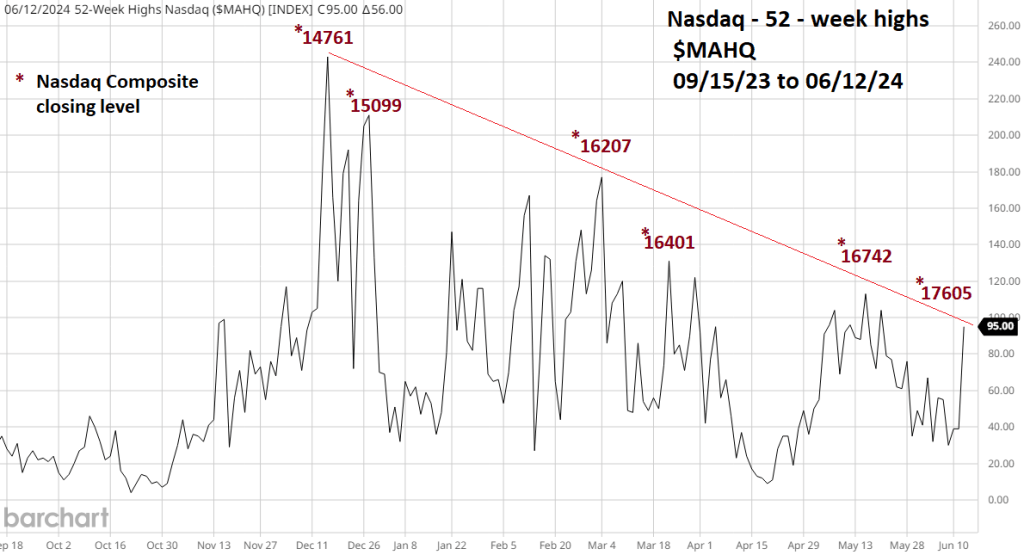
The process of shrinking – 52 – week highs has been underway for several months. Note that at each lower peak in 52 – week highs, the IXIC is at a higher level.
How much higher could the IXIC or SPX climb? The SPX daily chart courtesy of Trading view could provide an answer.
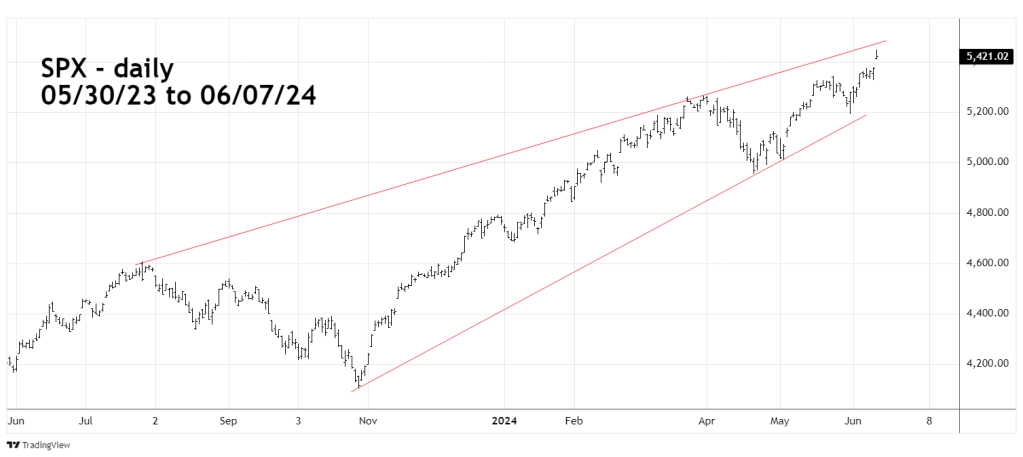
One level is the rising 52 – week trendline connecting the 07/27/23 and 03/28/24 peaks. In the next few trading days this line is in the area of SPX 5,470 to 5,480.
The next SPX daily chart illustrates another potential resistance level.

The SPX rally from the 04/19/24 bottom has taken the form of an Elliott wave extended Impulse pattern. Within Impulse waves typically the first wave is equal to the fifth wave. In this case Minor wave “1” is 135.92 points added the Minor wave “4” bottom of 5,327.25 targets SPX 5,463.17 as potential resistance.
