The 30 – minute S&P 500 (SPX) chart courtesy of Trading View updates its Eliott wave count.

There’s a good chance the SPX completed Minor wave “4” of the extended Impulse wave that began on 04/19/24. The bottom on 05/17/24 was very close to a .382 Fibonacci retracement of the presumed Minute wave “v” of Minor wave “3”.
In the 05/17/24 late day rally the SPX retraced about 50% of its 05/16/24 to 05/17/24 decline.
About 85 to 90% of the time fifth waves exceed the termination point of the third wave. When the fifth wave fails to exceed the third wave it’s called a truncated wave. This phenomenon cannot be predicted. However, a guess can be made if one stock index is lagging a related stock index.
The related stock index is illustrated in the 15 – minute Dow Jones Industrial Average (DJI) chart.
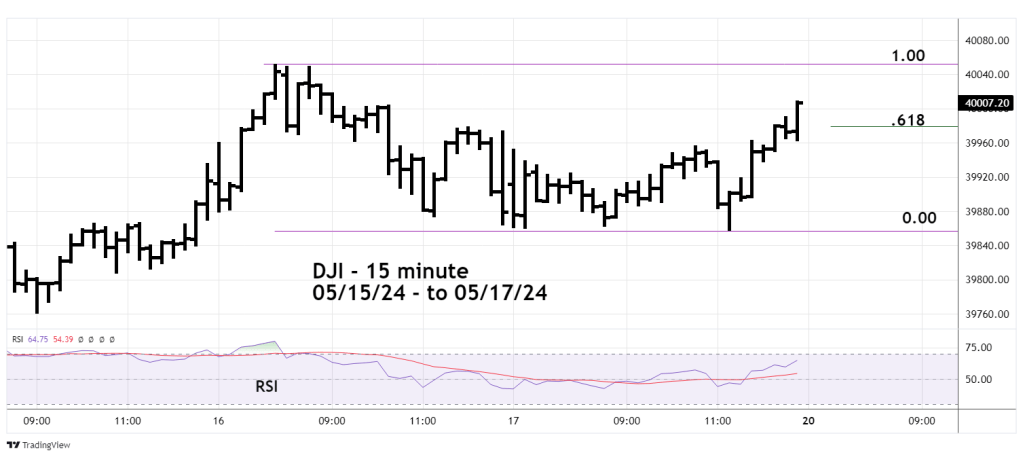
The DJI is currently the star of the U.S. stock market. Not only is it leading the other two main U.S. stock indices in upside action; it is also getting attention on price level.
On 05/16/24 the news media excitedly reported the DJI had for the first time crossed 40,000. On 05/17/24 they reported the DJI ended the session at 40,000. Happy days are here again!
Note that the DJI has exceeded a Fibonacci .618 retracement of its 05/16/24 to 05/17/24 decline. The SPX has only retraced a Fibonacci .50 of its respective decline.
If the rally continues on 05/20/24 and the DJI exceeds its 05/16/24 peak, watch to see if the SPX also makes a new high. If the SPX fails to match the DJI new high, it could be an important bearish signal.
The one – hour Russell 2000 (RUT) chart updates its action.

On the long -term RUT has been underperforming the main U.S stock indices since late 2021. The upside underperformance continues in the short- term.
All three main U.S stock indices have exceeded their late March 2024 peaks, while the RUT has yet to exceed its late March high.
The RUT post 04/19/24 rally peaked on 05/15/24 while the main indices made new all-time highs. On 05/16/24 the main indices continued to rise; RUT made a lower peak. On 05/17/24 RUT retraced only about 25% of its 05/15/24 to 05/17/24 decline.
In the next broad U.S. stock market decline RUT is likely to lead the way down.
On 05/15/24 traders were stopped out of the second half of a RUT short position started on the RUT open 04/01/24. The stop level was just above the RUT 04/04/24 high. The profit in the second half of the position was 0.55%.
There could be an opportunity to reenter a RUT short position in the next few trading days.
