Intraday S&P 500 (SPX) Elliott wave patterns and Fibonacci analysis imply more downside action.
The 5 – minute SPX chart courtesy of Trading View illustrates what’s happened since its all-time high.
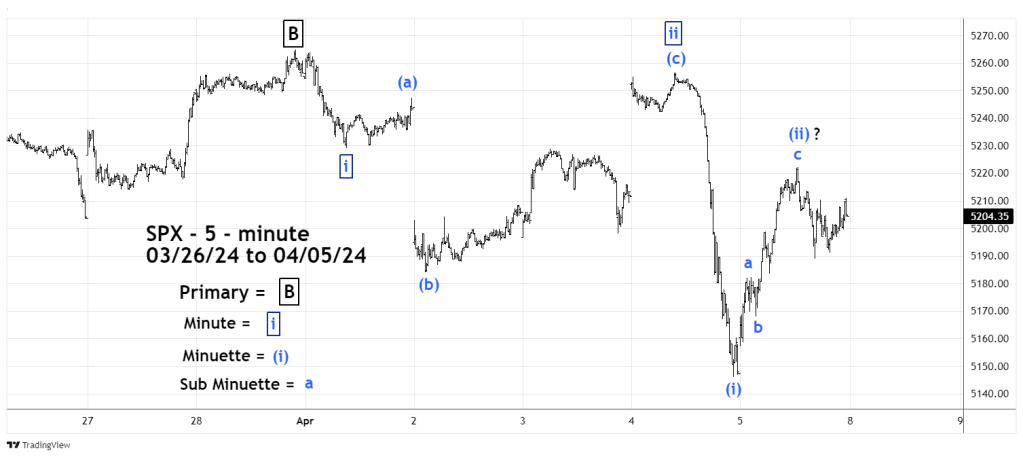
The decline from the SPX 03/28/24 peak appears to be a series of “one’s” and “two’s”. In down trending markets this is one of the most bearish Elliott configurations. If correct a very steep decline could be developing.
The first correction of the downward progress labeled Minute wave “ ii “ is an Elliott wave Inverse Expanding Flat. This is a very bearish corrective pattern because even as it corrects downside progress it still manages to make new lows. In this case Minuette wave ( b ) marks the low of the Inverse Expanding Flat.
The second correction of downside progress labeled Minuette wave ( ii ), if complete is an Elliott wave Single Zigzag. Minuette wave ( ii ) in both price and time is smaller than the presumed Minute wave “ ii ‘. This is what you would expect in a series of “one’s” and “two’s”.
The one – hour SPX chart shows a level that could be reached sometime during the week of 04/08/24 to 04/12/24.
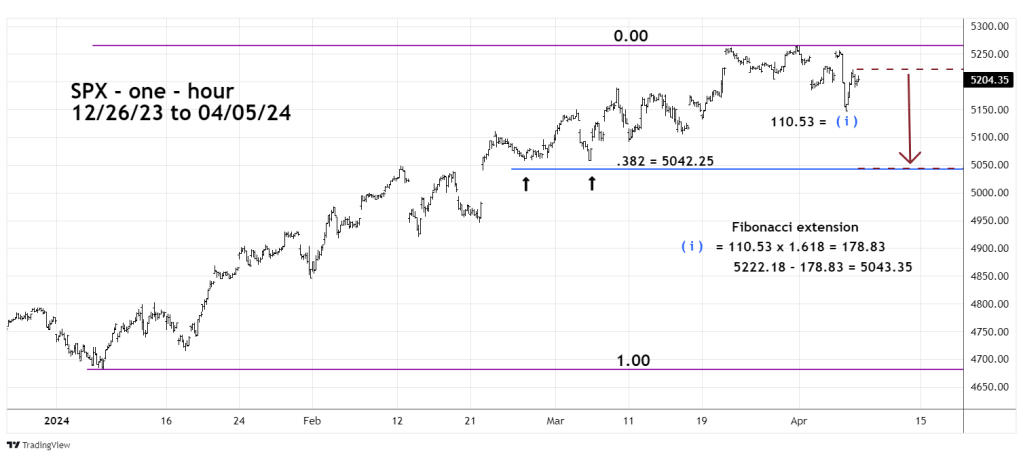
The primary Fibonacci coordinate is a .382 retracement of the January to March rally. The prime level is 5,042.25 just below correction bottoms made in late February and early March.
The secondary Fibonacci coordinate is derived from a Fibonacci extension of the presumed Minuette wave ( i ). The length of this wave was 110.53 points multiplied by the Fibonacci inverse ratio of 1.618 equals 178.83. Subtracting this amount from the presumed Minuette wave ( ii ) peak at 5,222.18 targets SPX 5,043.35 almost exactly the prime level of 5,042.25.
The proximity of the coordinates strongly implies a bottom could be made in that area. If so the bottom may not hold very long – perhaps only a few trading hours.
If the SPX has more downside action next week it could be just part of a larger downward plunge.
Its possible the SPX could reach its early January levels sometime in late April 2024.
