On 04/04/24 the S&P 500 (SPX) opened above potential resistances and came close to making a new all-time high. Stock bears had something else in mind.
The 30-minute SPX chart courtesy of Trading View shows what happened.
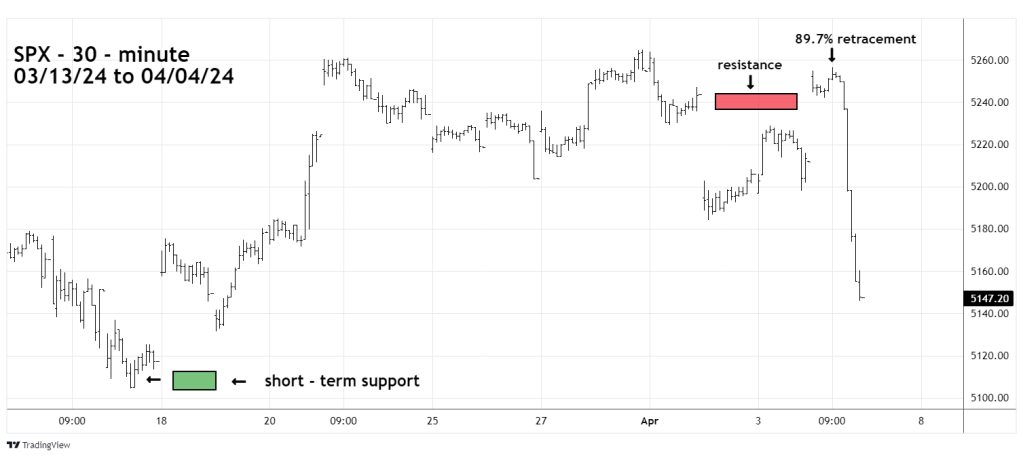
The highlighted resistance zone was noted in this websites prior blog. After rising into the middle of the session the SPX had retraced almost 90% of the 03/28/24 to 04/02/24 decline. What followed was a dramatic nearly vertical drop that took out the bottom made on 04/02/24 and continued until the end of the session.
A good clue a trend has changed is when something different happens. The failure to make a new high followed by a devastating decline has not happened since the SPX manic rally began on 10/27/23.
The next 30 – minute chart compares the performance of the Russell 2000 (RUT) small cap index with the SPX.
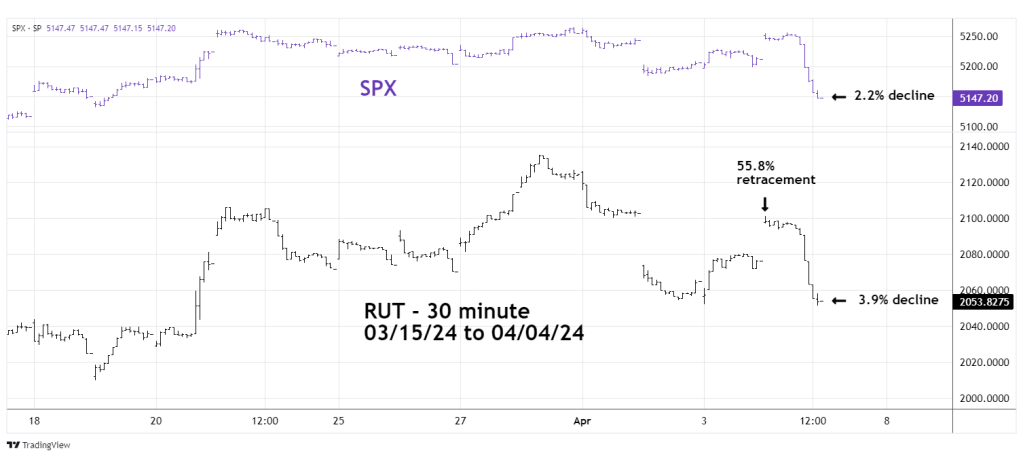
Traders initiated a 100% short position of non – leveraged RUT funds at the open of the 04/01/24 session. At the RUT high on 04/04/24 it had retraced only 55.8% of its prior decline. From its high on 03/28/24 RUT has declined 3.9% vs. 2.2% for the SPX.
The monthly U.S. payroll report is due out at 8:30 AM – EDT on 04/05/24.
Traders continue to hold 100% short RUT non-leveraged funds.
