The start of the 2024 second quarter has seen declines in the U.S. and other national stock markets.
The 03/24/24 blog “Major Fibonacci Time Cycles” illustrated an S&P 500 (SPX) turn in March 2024 using Fibonacci sequence numbers. The SPX all-time high came on 03/28/24. If the March 2024 SPX high holds it could be the starting point of at least a multi – month decline.
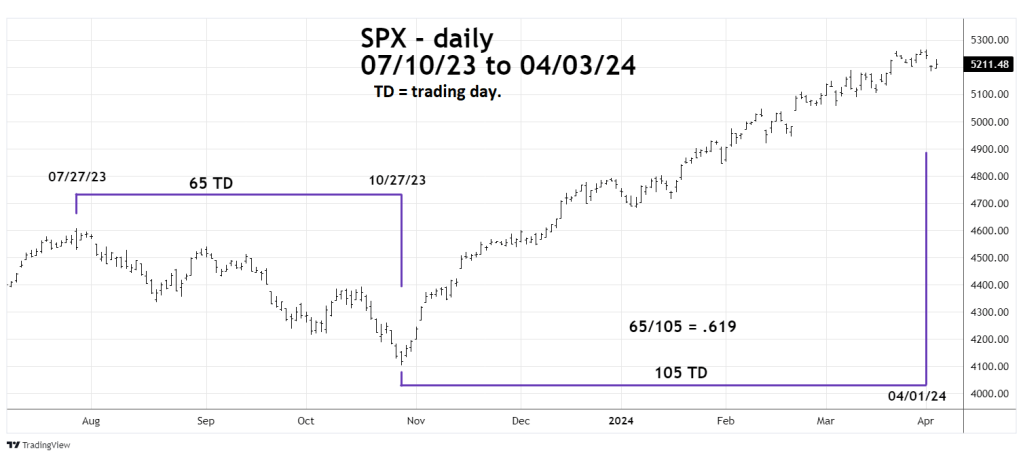
The daily SPX chart courtesy of Trading View shows a potential turn using Fibonacci time ratios.
Fibonacci time ratios like Fibonacci price ratios allows for leeway.
The three month – July to October decline has a Fibonacci ratio relationship with the October to March five – month rally. Three months/five month equals .60.
Measured in trading days to 04/01/24 its 65/105 or .619 which is almost the Golden Fibonacci ratio of .618.
The measurement from the SPX 03/28/24 high is 65/104 or .625 and within leeway of .618.
From 04/01/24 to 04/02/24 the SPX declined, then rallied on 04/03/24. In Elliott wave terms the drop could be the first wave down. Typically, after the first wave there’s at least a .618 retracement.
The 30- minute S&P 500 – June 2024 – E-Mini chart illustrates potential resistance.

The Volume Profile method has volume on a vertical axis corresponding to price levels.
A wide area can be potential support/resistance. The widest part is called Point of Control (POC) and could be the strongest support/resistance level.
POC for the 04/0124 to 04/02/24 decline is at 5,290.50 and is equivalent to about 5,237.00 on the SPX. This chart was taken after the close of the SPX 04/03/24 session. Note in the post SPX session the S&P 500 – E- Mini futures have exceeded the SPX 04/03/24 session high.
Just above 5,290.50 is a Fibonacci .618 retracement at 5,296.25. These two coordinates are the broader resistance area.
European and Asian stock markets also experienced declines at the start of the second quarter. Its possible a global stock market decline has begun.
