The post U.S. – FOMC rally has brought the S&P 500 (SPX) to a potentially very important resistance zone.
The daily SPX chart courtesy of BigCharts.com shows the big picture.
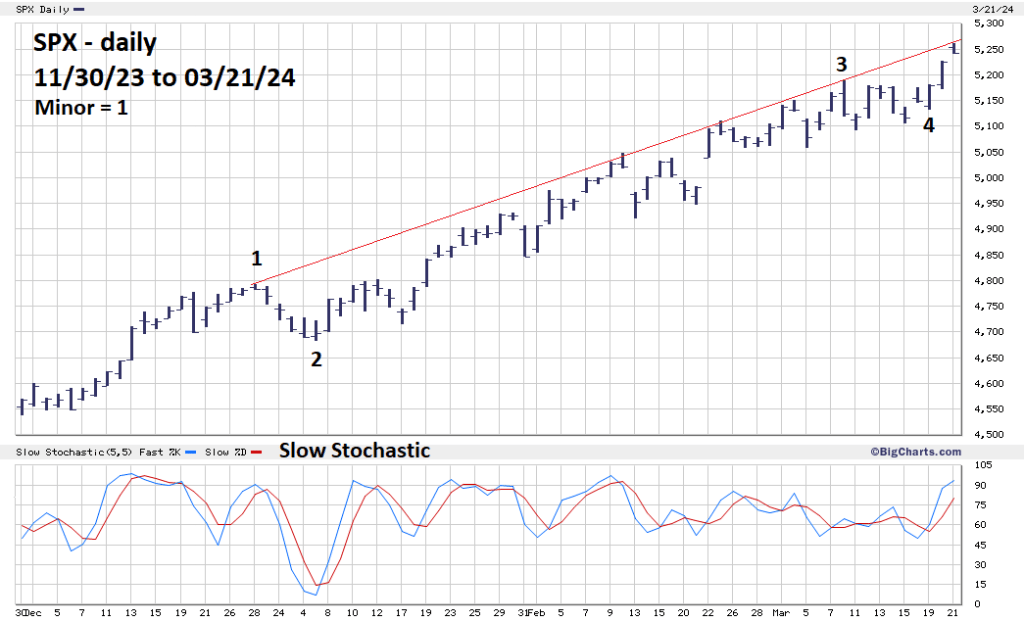
Today the SPX came close to hitting the rising trendline connecting the peaks of Minor waves “1” and “3” of the rally from the 10/27/23 bottom.
Also note the red line of Slow Stochastic has reached the overbought zone which begins at 80.00.
The 15-minute SPX chart courtesy of Trading View zooms in on the intraday Elliott wave count.

The presumed Minute wave “i” appears to be an Elliott wave Leading Diagonal Triangle. The subsequent steep rally has the look of a third wave which is usually the longest and strongest sub wave of an Impulse pattern.
The high of the day was about 4 – points below the rising trendline, and 7.24 – points above the Fibonacci resistance point at 5,253.10.
The 3 – minute SPX chart illustrates a possible Elliott wave count.
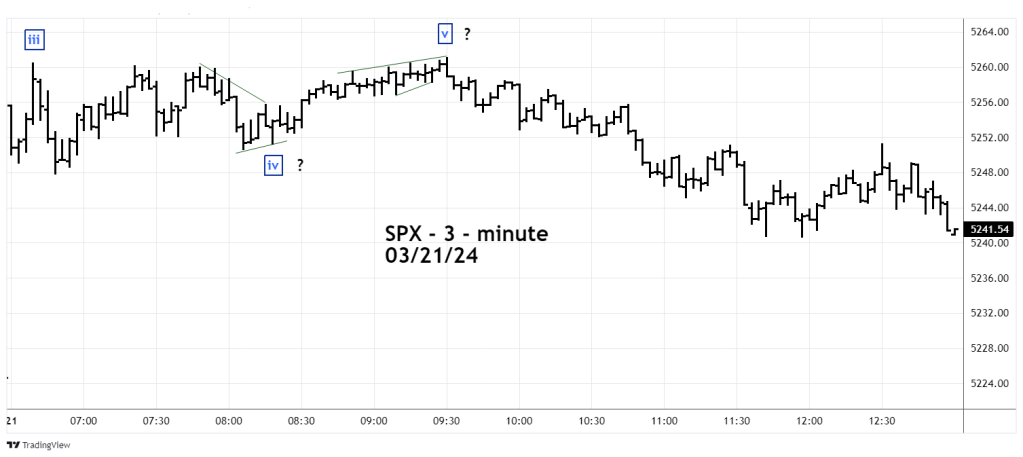
It’s possible the SPX manic bull phase from the 10/27/23 bottom terminated at the 10/21/24 high.
After the SPX early session high, it meandered sideways in what could be an Elliott wave – Horizontal Triangle – labeled Minute wave “iv”. The subsequent slow and choppy rally could be an Elliott wave – Ending Diagonal Triangle – labeled Minute wave “v”.
If on 03/22/24 the SPX moves above the 03/21/24 high – it implies the SPX 03/21/24 low could be Minute wave “iv”.
If on 03/22/24 the SPX moves below the 03/21/24 low – it increases the chance that a very important top may have been made at the 03/21/24 high.
