In two or three trading days the S&P 500 (SPX) could reach important resistance.
This websites 03/18/24 blog noted.
“It’s possible the presumed Horizontal Triangle could be complete at the 03/18/24 low.
More likely the SPX could trend down until sometime before the U.S. FOMC announcement due 2:00 PM – EDT on 03/20/24.”
Also illustrated was this SPX – 30-minute chart courtesy of Trading View.

The next SPX – 30- minute chart shows what happened.
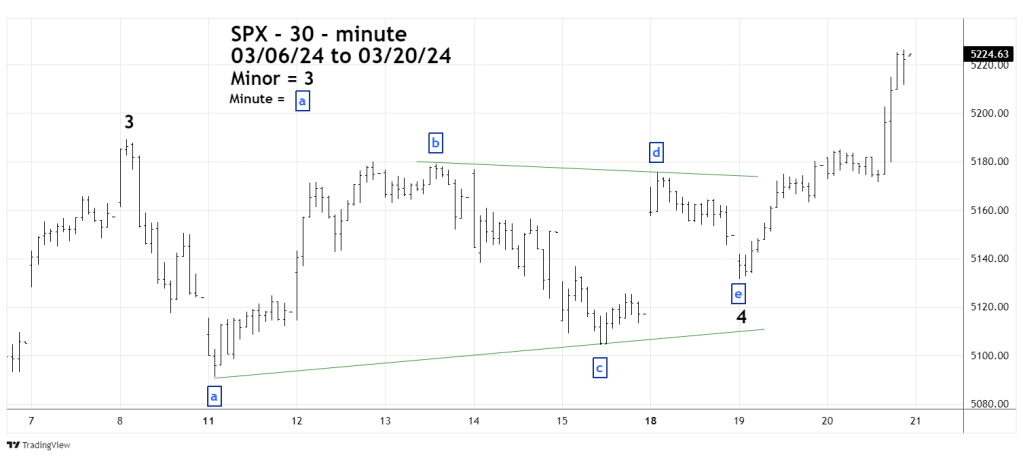
There’s a high probability that the Horizontal Triangle pattern was completed at the SPX open on 03/19/24. After the end of a Horizontal Triangle there’s usually a thrust in the direction of the main trend – which in this case is up.
The daily SPX chart courtesy of Bigcharts.com illustrates the bigger picture.
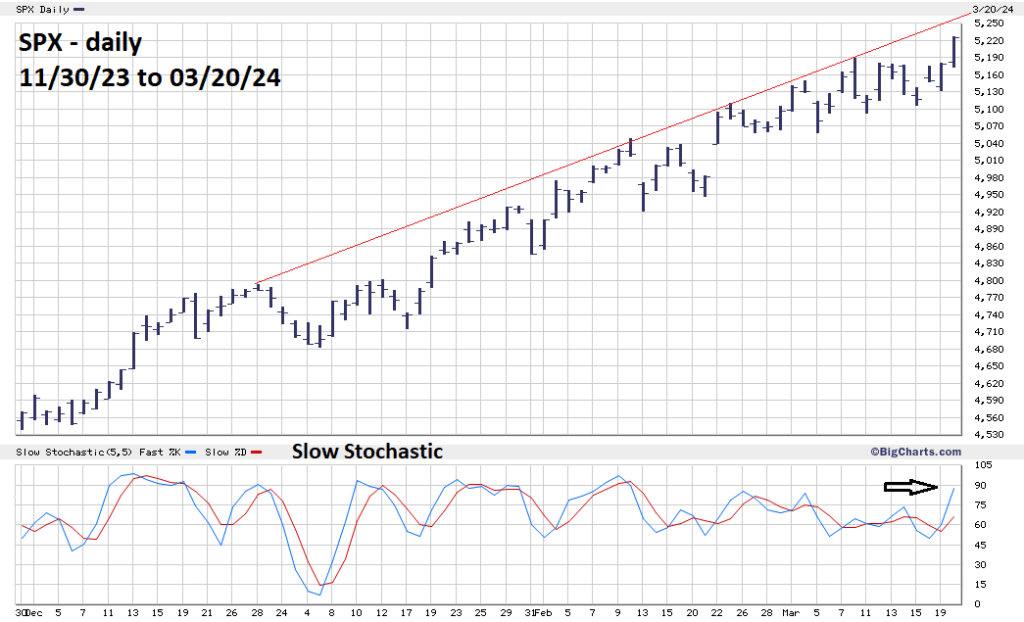
The blue line of BigCharts.com, very effective Slow Stochastic has reached the overbought zone which begins at 80.00. The red line could reach the overbought zone in two or three trading days.
The rising trendline from the late 2023 peak crosses the 5,260 to 5,270 area on 03/22/24 to 03/25/24.
The 03/13/24 blog “S&P 500 – Elliott Wave Pattern From October 2023” noted important Fibonacci resistance at SPX 5,253.86.
There’s a high probability the SPX could reach the area of 5,250 to 5,280 on either 03/22/24 or 03/25/24.
