On 02/13/24 the U.S. stock market had a large steep decline. Subsequently the three main U.S. stock indices have rallied with the S&P 500 (SPX) being the strongest, on 02/16/24 it was only 9.69 points from its all-time high. The SPX ended the session down, just above important intraday support.
The 15 – minute SPX chart courtesy of Trading View illustrates its intraday action.
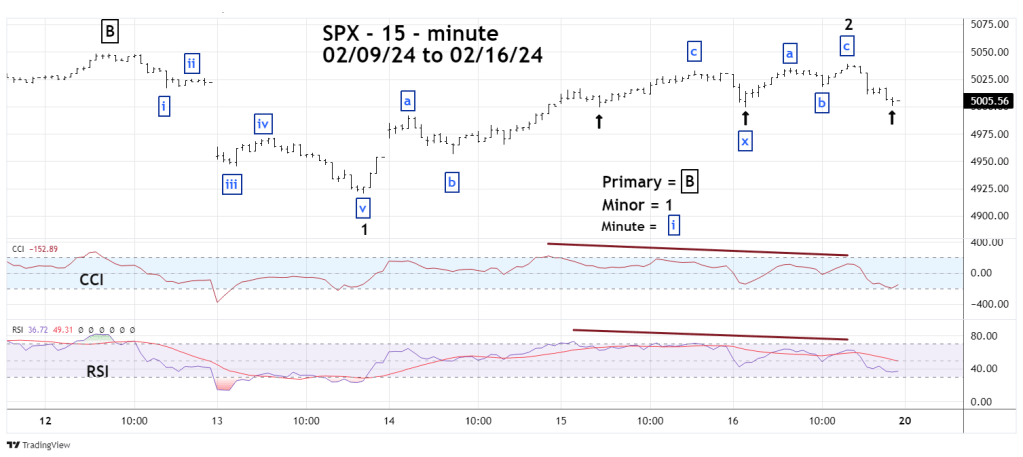
The SPX move from 02/12/24 to 02/13/24 appears to be an Elliott – Impulse wave. If so, this implies the decline could be the first wave of a larger developing bear trend. The rally after 02/13/24 looks like an Elliott wave – Double Zigzag, a corrective pattern of the primary trend.
On 02/16/24 the SPX late session low was at 5,000.51 just above the low of the day made at 4,999.52, which is just above the 02/15/24 correction low of 4,999.44.
The bulls are defending SPX 5,000.00.
Intraday momentum is bearish. Both CCI and RSI had significant bearish divergences at the 02/16/24 peak.
The next 15 – minute SPX chart shows the 02/13/24 to 02/16/24 rally from the perspective of Volume Profile.
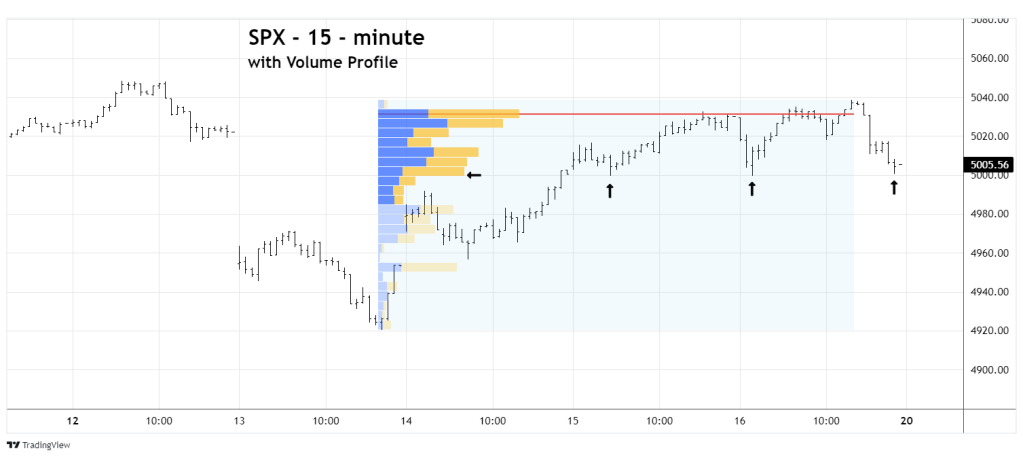
Volume Profile illustrates volume on a vertical axis and is a representation of the volume traded at different price levels. Wide volume cluster are potential support/resistance. Volume Profiles normally form a “Bell Curve” with the widest part in the middle of the profile and tapering off in the upper and lower parts.
When the profile has the widest part at the top of the structure, it’s a sign of short covering. This implies a minority of the money initiating new long positions. If most of the short covering is exhausted, there may not be enough fuel for the rally to continue.
Also note the SPX bottom on 02/16/24 was at the lower boundary of the volume cluster.
The most likely intraday SPX – Elliott wave count is bearish. There are always low probability alternate wave counts. Low probability does not mean no probability.
In recent weeks the main U.S. stock indices have been driven higher by a small group of powerful stocks. On 02/21/24 Nvidia Corporation (NVDA), perhaps the most powerful stock of all – reports its quarterly earnings. If the report is viewed as bullish, it could trigger a move up in the U.S. stock market and possibly a new all-time high for the SPX.
On the bearish side of the coin, an SPX break below 4,999.44 could open the door to a move down to the 02/13/24 bottom. The cash U.S. stock market is closed on 02/19/24 for Presidents Day. What happens on either 02/20/21 or 02/21/24 could determine the near-term action for U.S. stocks.
Watch SPX 5,000.
