Most of the gains in the main U.S. stock indices since the 10/27/23 bottom can be attributed to the Technology sector. The manic move up in tech stocks could be the terminal phase of the bull market that began in October 2022.
The daily chart for SPDR Select Sector Fund – Technology (XLK) courtesy of Trading View shows what’s happened.

The bull market that began in October 2022 has taken the form of an extended Elliott wave Impulse pattern. The recent move up from 10/26/23 is probably Intermediate wave (5), the final part of the thirteen-month rally.
There’s usually a Fibonacci relationship between waves “one” and “five” of Impulse patterns. In this case because of the large gain since October 2022 its more appropriate to compare percentage gains between the waves as opposed to points.
Intermediate wave (1) which peaked in December 2022 gained 23.3% multiplied by the Fibonacci ratio of .618 calculates to a 14.4% gain. Intermediate wave (4) bottomed on 10/26/23 at 159.50. Adding a growth rate of 14.4% to 159.50 targets 182.50. The XLK high on 11/17/23 was 183.50.
Daily RSI has reached the overbought zone and so far has no bearish divergence. MACD – Histogram has a small bearish divergence. Sometimes blowoff tops can peak without an RSI bearish divergence. Its possible XLK made a very important top on 11/17/23.
SPDR has eleven – Select Sector funds. As of 11/17/23 only the technology sector has made a new all-time high.
The weekly Technology sector XLK and Consumer Staples sector (XLP) chart illustrates a shocking divergence.
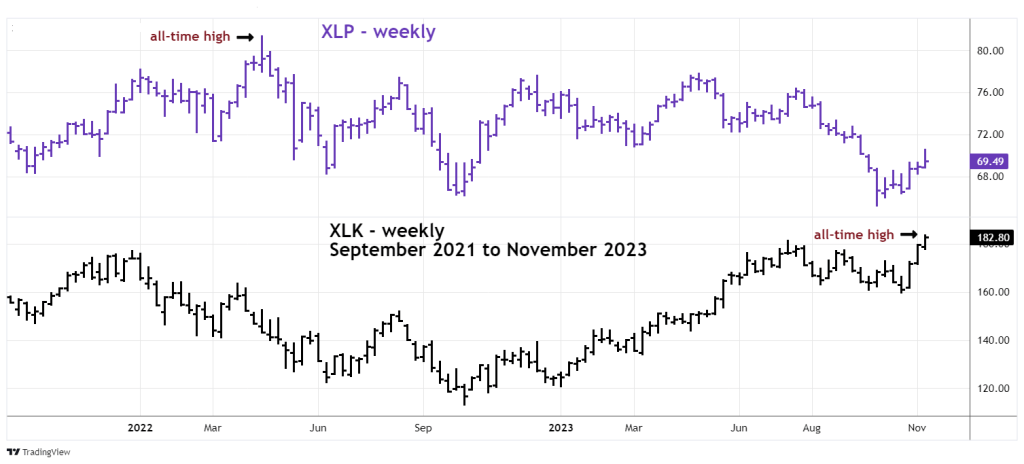
XLK has made a new all-time high while XLP has retraced only 33% of its 2022 to 2023 decline. Also note that in October 2023 XLP went below the bottom it made in October 2022.
This type of outrageous divergence is not what you would expect if the post October 2023 rally was the start of a bull market going well into 2024.
The daily chart of Apple Inc. (AAPL) details a fascinating Elliott wave pattern.
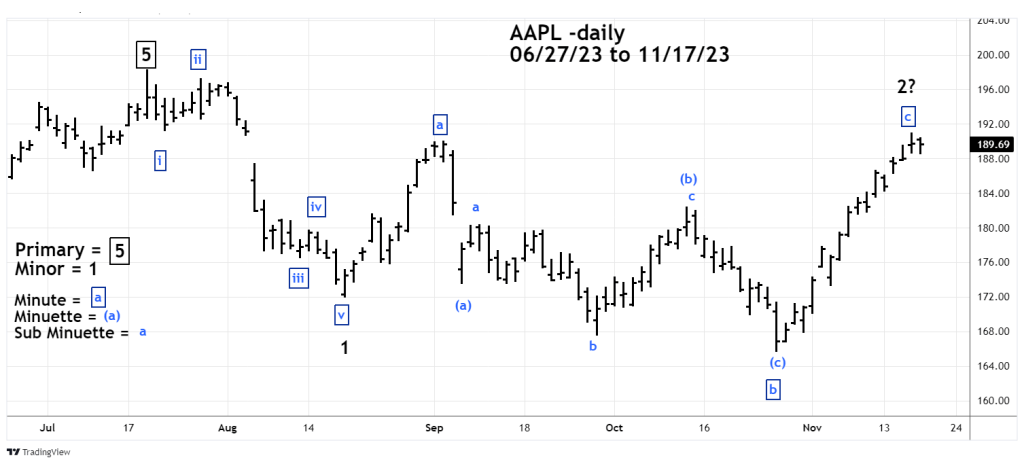
The 08/27/23 blog “Apple Inc. – Clear Elliott Wave Pattern” illustrated AAPL had a clear five – wave decline from its 07/19/23 all – time high. The subsequent counter trend move appears to be an Elliott wave – Inverse Expanding Flat. Note that in the middle of this structure there’s a smaller degree Inverse Expanding Flat. Its labeled as Minuette wave (b) that peaked on 10/12/23.
Within Expanding Flats there’s usually a Fibonacci relationship between waves “A” and “C”. In this case Minute wave “a” – boxed is 18.02 points multiplied by the Fibonacci inverse ratio of 1.382 calculates to 24.90 points. The presumed Minute wave ‘b” bottom is at 165.67 adding 24.90 points targets a top at 190.57. The AAPL high on 11/16/23 was 190.96. It’s possible AAPL made an important peak on 11/16/23.
A characteristic of multi – month or multi-year stock bull markets is sector harmony. For several months the technology stocks have been outperforming several sectors by a wide margin – that is not sector harmony.
If tech stocks peak perhaps there could soon be sector harmony – to the downside.
