On 11/16/23 Crude Oil appears to have made an intermediate degree bottom.
The daily Crude Oil futures continuous contract (CL2!) courtesy of Trading View shows the progress of its decline since 09/28/23.
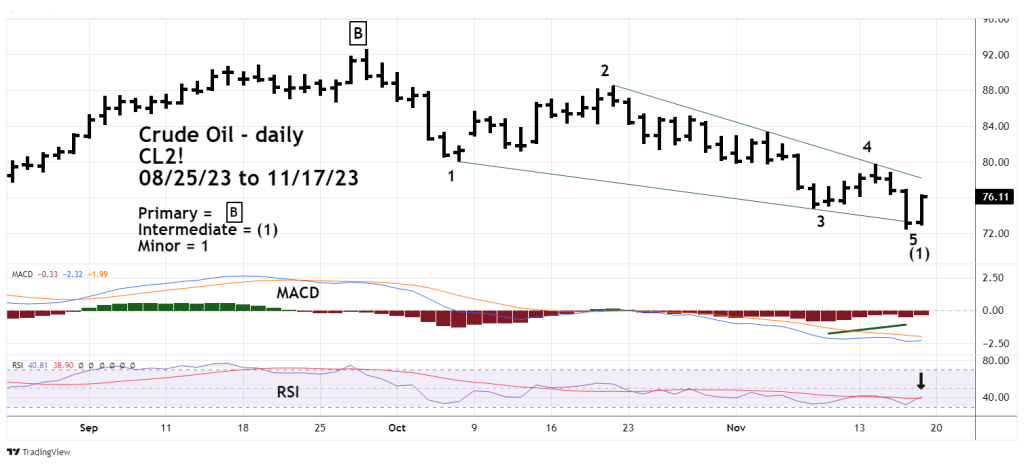
The decline counts as a five – wave Elliott Impulse pattern. There’s a bullish MACD – Histogram divergence. RSI has moved above its daily moving average. So far daily RSI has not reached the oversold zone that begins at 30%. Also, RSI had no bullish divergence at the 11/16/23 bottom.
There are declining converging trendlines from the 10/06/23 bottom and the 10/20/23 top. The 09/28/23 to 11/16/23 drop does not look like an Elliott wave – Ending Diagonal Triangle or a Leading Diagonal Triangle. However, in standard Technical analysis converging declining trendlines are bullish.
There’s sufficient evidence to suggest an intermediate bottom could be in place.
Traders are holding a 50% position in the Proshares Ultrashort Bloomberg Crude Oil fund.
Sell half of the 50% position on the NYSE main session open at 9:30 AM – EST – 10/20/23.
