The S&P 500 (SPX) may have completed an important Elliott Wave pattern.
The 3 – hour SPX chart courtesy of Trading View illustrates the most likely Elliott wave count from late July 2023.
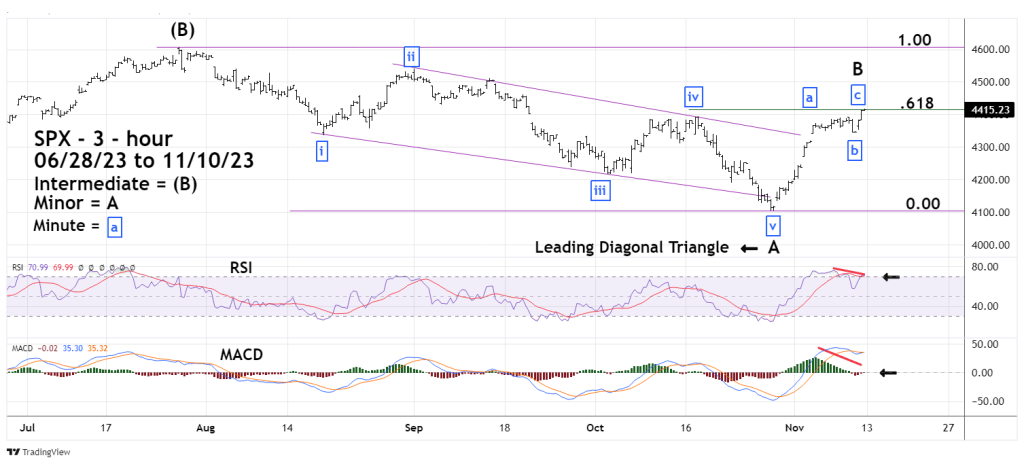
The SPX decline from 07/27/23 to 10/27/23 appears to be an Elliott wave – Leading Diagonal Triangle (LDT). This structure only occurs in the “A” wave position of corrective patterns and in the first wave of impulse patterns. LDT’s have converging trendlines and each of the three sub motive waves subdivide into five waves. Wave “four” of the structure always overlaps into the territory of wave “one”. LDT’s are the first phase of a larger developing pattern – in this case down.
The most common Fibonacci retracement level for either wave “A” or wave “one” is .618.
The .618 retracement level of the SPX July to October drop is 4,414.81, the SPX high on 11/10/23 was 4,418.08.
The structure of the rally from 10/27/23 to 11/10/23 is a three-wave corrective pattern. The move from 10/27/23 to 11/03/23 is an impulse wave. The action from the 11/03/23 high to the 11/09/23 bottom is an Elliott wave – Expanding Flat correction. The move up from 11/09/23 is an impulse wave.
External momentum indicators are bearish. The 3 – hour RSI has a double bearish divergence at the SPX 11/10/23 high. MACD lines have a bearish divergence and Histogram have a significant bearish divergence.
Internal momentum indicators also have bearish divergences. The daily SPX – advance/decline line ($SPXADP) chart courtesy of StockCharts.com shows what’s been happening underneath the surface.
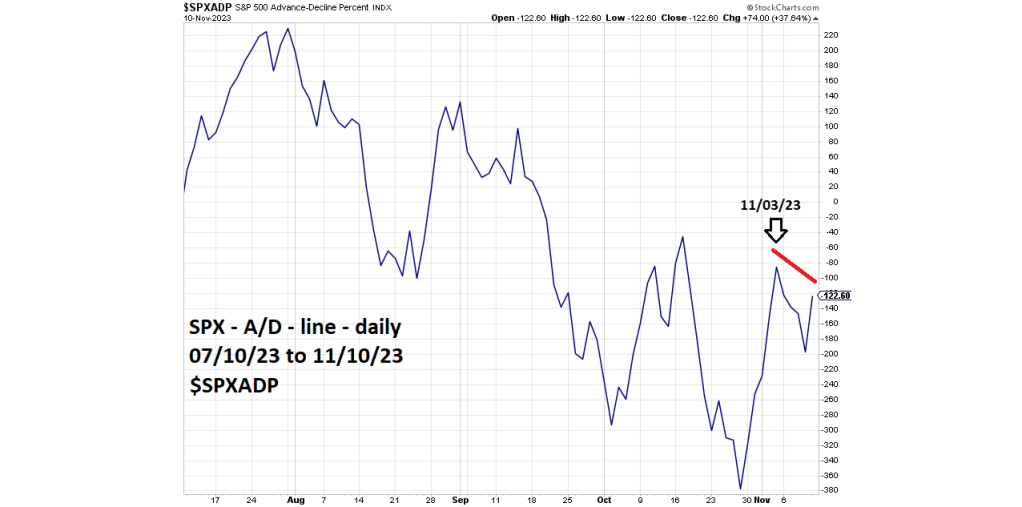
There was a significant bearish divergence on 11/10/23 vs. the A/D line top on 11/03/23. Additionally, on November 6th,7th , and 8Th the SPX closed higher than the prior day close while the A/D line declined! One SPX higher close with an A/D line decline is bearish. Three days in a row of the SPX rising with the A/D line declining is extraordinarily bearish, and perhaps unprecedented in the history of the SPX.
Evidence from the NYSE – 52 – week highs ($MAHN) chart courtesy of Barchart.com also shows a bearish divergence.
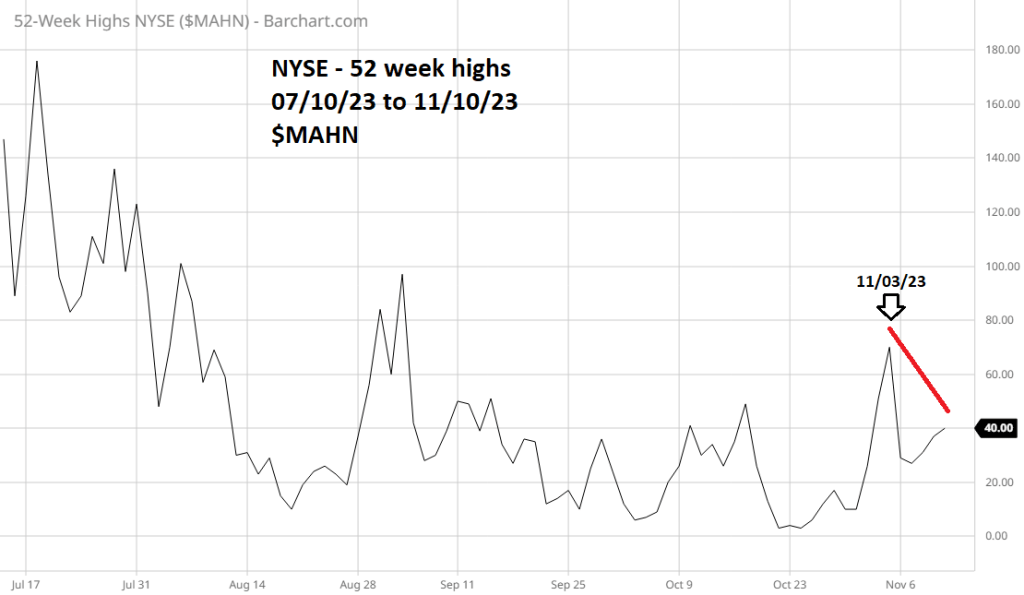
Again, we are seeing a bearish divergence with the high made on 11/03/23. This is very significant from an Elliott wave perspective.
There are always alternate wave counts. The SPX rally after the 11/09/23 could be the start of the third wave in a developing five wave impulse pattern. In stocks the third waves are usually the longest and strongest. If the post 11/09/23 move up was wave “three” of a developing impulse, new highs would be expected to expand not contract.
The evidence presented in this blogs three charts make a powerful case that a significant top could be forming. But wait there’s more!
Sometimes markets will make important turns within plus or minus two trading days of a new or full moon. Stock markets tend to have tops on new moons, bottoms on full moons.
On Saturday 10/14/23 there was a new moon, the SPX made a top on 10/17/23.
On Saturday 10/28/23 there was a full moon, the SPX made a bottom on 10/27/23.
There’s a new moon on Monday 11/13/23.
Most importantly the Dow Jones Industrial Average is on the verge of a “Death Cross”!
In just 10 – trading days the SPX has retraced 61% of a 3 – month decline. Could the rise be the kickoff to a multi- month bull phase, or a bear market rally that went too far too fast? We may have an answer next week.
