The S&P 500 (SPX) opened the 10/09/23 session down 19.47 points. It appeared a significant decline could be developing. After about 80 – minutes the bears were only able to move marginally below the opening bottom. Subsequently there was another relentless rally that continued though most of the session.
The daily SPX chart courtesy of Trading View illustrates the action.
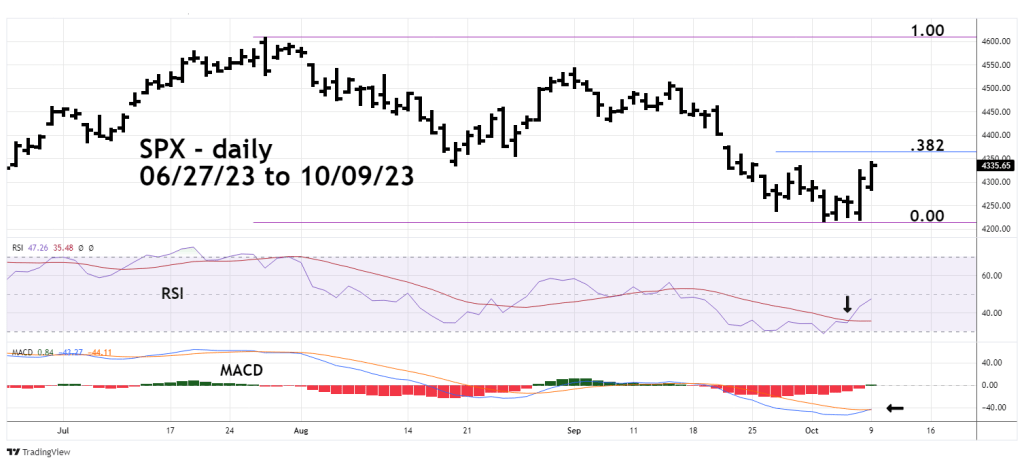
Late last week the daily RSI moved above its moving average line. Today MACD had a bullish lines crossover.
The SPX could be rallying into a short-term top near the Fibonacci .382 retracement of the July to October decline.
Today on the SPX open, traders exited a 50% short position of non – leveraged SPX related funds that was initiated at the SPX open on 07/05/23.
The move down was 3.4%, the gain on a 50% position is 1.70%.
If there’s a pullback in the next few trading days it could present an opportunity to go long SPX related funds.

I appreciate your analysis, and I concur with your assessment. I exited my short position last week and shifted to a long position. However, I’d like to draw attention to a matter of concern: my mid-term indicator indicates a potentially worrisome outlook for Q4. In other words, I am carefully monitoring any indications of a downtrend, as I currently anticipate further challenges in the market until the end of the year.
LikeLike
Thanks for the comment.
LikeLike