Something happened on 10/06/23 that indicates U.S. stocks may have made an intermediate bottom.
One part of the “Volume Profile” analysis method is measuring a markets opening range. The best way to use “Volume Profile” for the S&P 500 (SPX) is to examine the nearest S&P 500 – E – Mini futures contract, currently December 2023.
The opening range is the first hour of the main trading session. For the S&P 500 – E – Mini its 9:30 AM to 10:30 AM – EDT.
After the opening range is established, moves above/below the range can help determine the strength of the move during the day and beyond. The unit of measurement for the S&P 500 – E-Mini is one tick or a quarter of a point. A move of 8 – ticks is 2.00 points.
On 10/06/23 the move above the opening range was 330 – ticks which is exceptionally large, it was the biggest reading since the fourth quarter of 2022.
On 10/13/22 the S&P 500 – E-Mini moved 541 – ticks above the opening range which was the start of the kickoff phase to a 9 – month bull move. The next highest reading was 452 – ticks made on 11/30/22, the end of the kickoff phase.
The move of 541- ticks signaled the start of a 9 – month bull run. Perhaps a 330-tick move is signaling a 2-to-6-month rally?
The daily SPX chart courtesy of BigCharts.com illustrates near-term momentum.
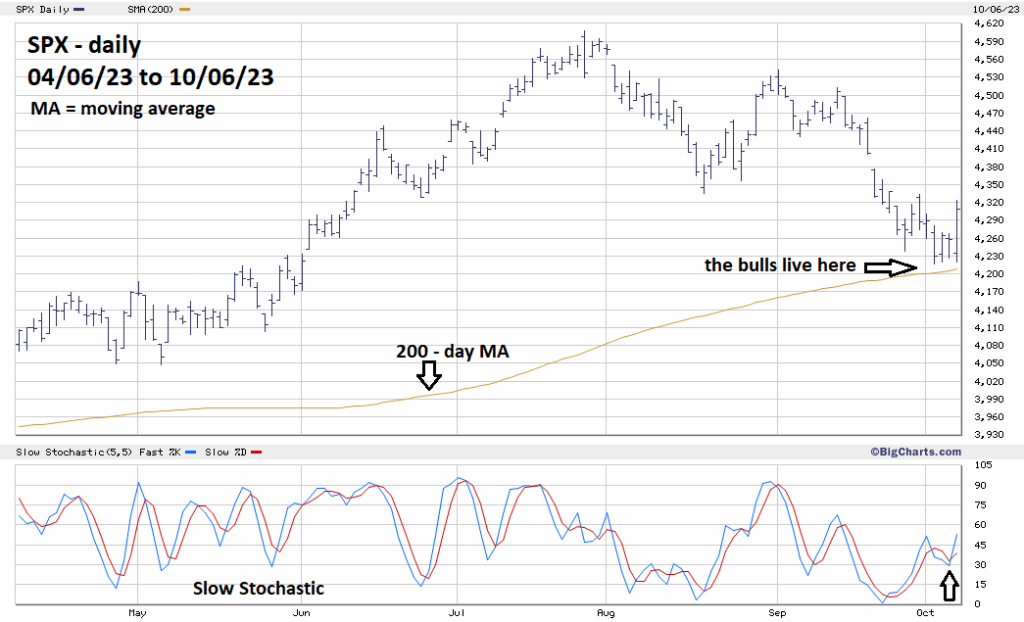
Recent blogs of this website have noted the importance of the SPX – 200-day moving average (MA). Note the buying that occurred as the SPX approached the line.
BigCharts.com – Slow Stochastic is one of the most effective price oscillators. On 10/06/23 there was another bullish lines cross. Most importantly, the lines are in the middle of the neutral zone. The SPX could rally more than 100 – points from its 10/06/23 close with the Slow Stochastic line below 80% – overbought.
Moving up more than 100 – points could be a very significant bullish event as illustrated on the SPX – 4 – hour chart courtesy of Trading View.
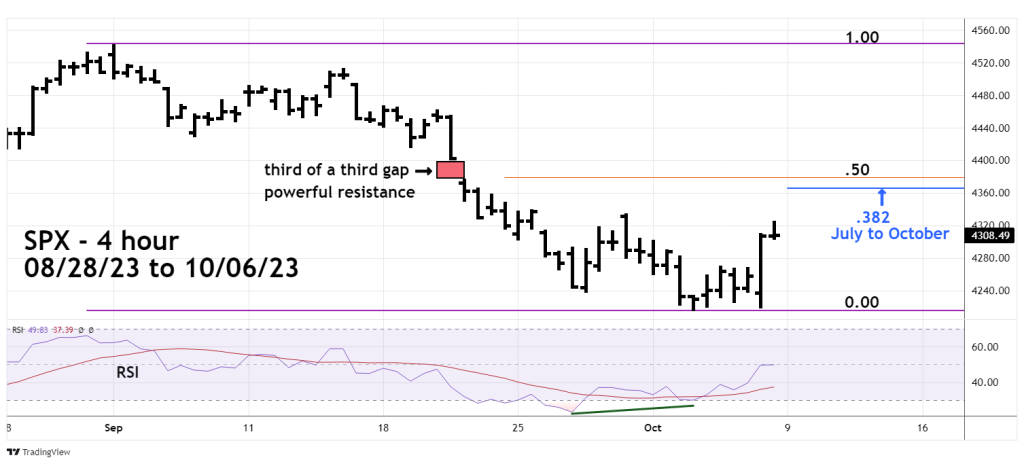
Two Fibonacci coordinates close together represent strong support/resistance. The main Fibonacci coordinate, the .382 retracement of the July to October decline is at SPX 4,365.66. The secondary coordinate, the .50 retracement of the September to October drop is at 4.378.85.
Just above this strong resistance is a price gap. In Elliott wave structure this is the third of a third wave down of the September to October Impulse wave. This is usually the most dynamic Elliott wave structure, and in stock declines represent maximum fear.
If the SPX can rally above this powerful resistance zone it opens the door for a move above the 07/27/23 top.
The next daily SPX chart examines some fascinating Fibonacci price and time relationships.
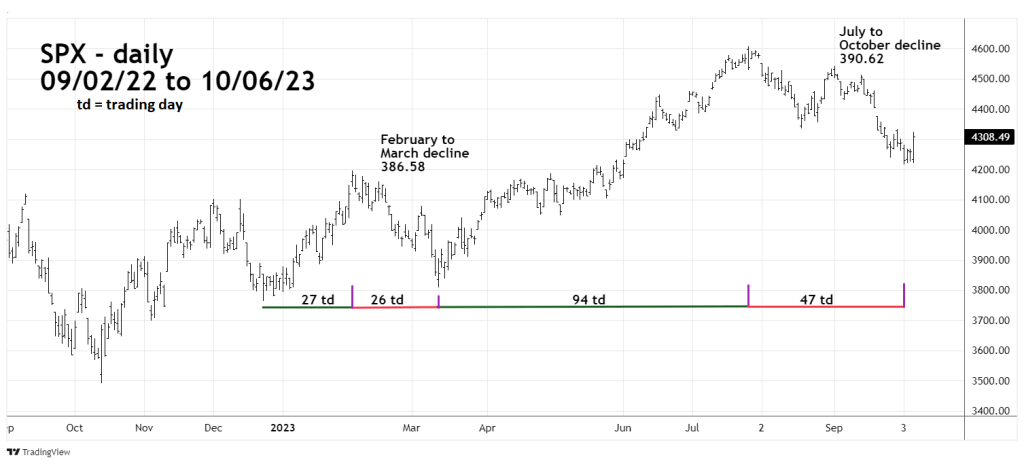
The July to October decline is so far 390.62 points. Almost equal to February to March drop of 386.58 points, a difference of only 4.04 points.
The December to February rally was almost equal to the February to March decline of 26 -trading days. The July to October drop took 47 – trading days, which is a Fibonacci .50 of the March to July rally of 94 – trading days.
There’s a correlation between the degree of a market turn and evidence supporting a market turn. At the SPX October 2022 bottom there was a tremendous amount of bullish evidence which resulted in a 9 – month bull phase.
Currently there’s only a moderate amount of evidence. Seasonal patterns are bearish into October, there’s still plenty of time for stock prices to trend lower. Additionally, sentiment has not reached extremes seen at major stock market bottoms.
Perhaps only an intermediate bottom is forming, leading to a 2 to 6 – month rally?
There’s enough evidence for bears to be cautious.
Traders are short 50% – SPX related non – leveraged funds from the SPX open on 07/05/23. Close out the 50% short on the SPX open 10/09/23.
An opportunity to go long the SPX could be developing, let’s see what happens on 10/09/23.
