Nvidia Corporation (NVDA) bearish technical situation was illustrated in the 08/13/23 blog “Follow the Leaders”. Since then, the technical condition of the stock has gotten more bearish.
The weekly NVDA chart courtesy of Trading View illustrates the action since 2022.
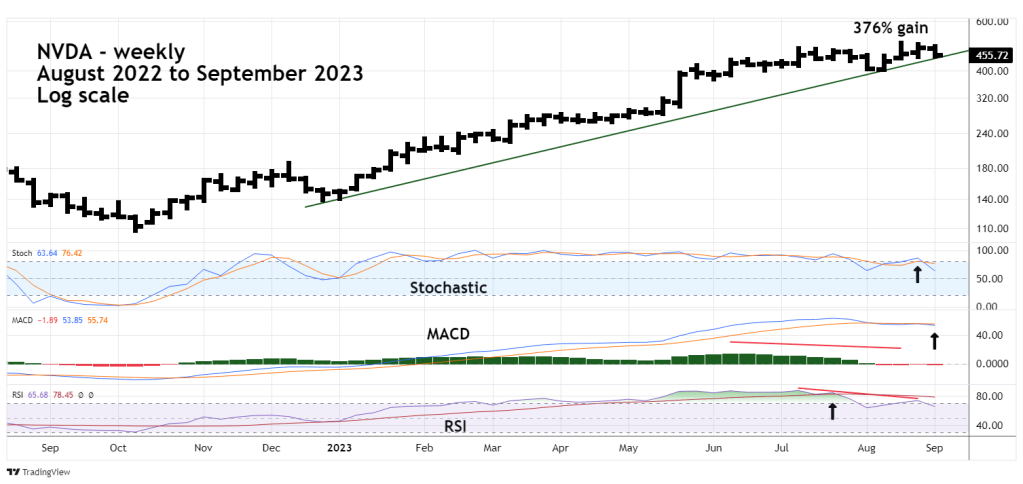
In bull markets there are usually one or two stocks that are spectacular upside leaders. With a 376% gain from October 2022 to August 2023 NVDA definitely qualifies as a leader of the post October 2022 bull market.
Weekly Stochastics has bearish lines cross and is in the upper part of the neutral zone, implying considerable room to go down.
MACD – Histogram had a significant bearish divergence at the August 2023 peak and recently had a second bearish lines cross.
The 08/13/23 blog noted that at the July peak there was no bearish RSI divergence. Subsequently at the August 2023 top there was a bearish divergence and RSI is continuing to trend below its weekly moving average line.
Finally, note the rising trendline from the December 2022 bottom.
The daily NVDA chart gives a more detailed picture.

As of 09/08/23 NVDA was at the rising trendline. This could indicate NVDA is at an important support level. A significant break below the trendline could signal the start of a deep decline.
Daily Stochastic has yet to reach the oversold zone, which begins at 20%. Stochastic is a sensitive oscillator and the daily lines could remain in the oversold zone for more than a week.
MACD has a bearish line cross coming off a bearish divergence.
Daily RSI recently had a double bearish divergence and has moved below its daily moving average line.
The one – hour NVDA chart focuses on the short – term view.
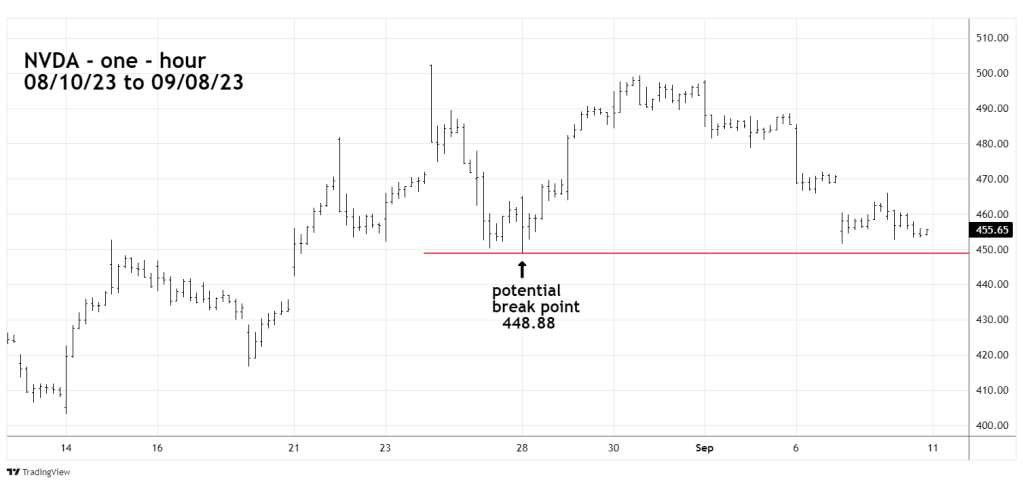
Breaks below/above chart support/resistance are usually very effective at confirming trendline breaks.
A move below the 08/28/23 bottom at 448.88 could signal the start of a significant decline. The next support area is in the low 400’s. A break below 400 could open the door for a move down to 300.
NVDA was a major upside leader of the post October 2022 rally and topped weeks after all three main U.S. stock indices. If this leader is in a bear phase, there’s a high probability the main U.S. stock indices could follow it down.
Watch NVDA and its support at 448.88.
