Daily momentum for the S&P 500 (SPX) implies more downside action.
The daily SPX chart courtesy of Trading View updates the action.

Daily Stochastic had a bearish lines cross three – trading days ago and the lines are in the upper part of the neutral zone. Today 09/07/23 RSI crossed below its moving average line. MACD is trending down with no bearish line cross.
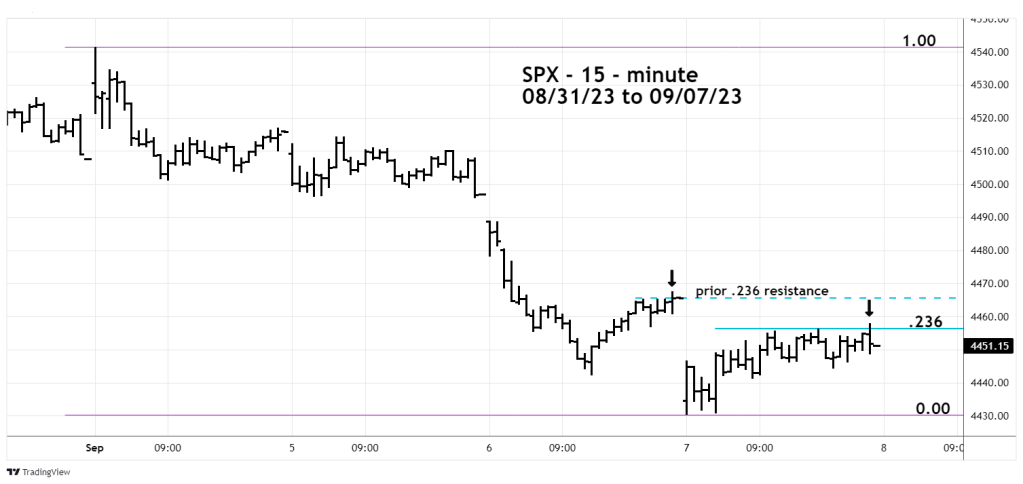
The 15 – minute SPX chart illustrates the action after the 09/01/23 peak.
The 09/06/23 blog noted.
“The late day rally on 09/06/23 reached a Fibonacci .236 retracement of the 09/01/23 to 09/06/23 decline. This level typically halts rallies within powerful downtrends.”
Today 09/07/23 the same phenomenon occurred. Late in the 09/07/23 session the SPX briefly pushed above the Fibonacci .236 retracement of the 09/01/23 to 09/07/23 decline.
An SPX open on 09/08/23 below 4,458.00 implies more downside action.
Important support is the 09/07/23 bottom at 4,430.46.
