The 08/16/23 blog “S&P 500 – Downside Targets – 08/16/23” noted.
“A Fibonacci .236 retrace of October 2022 to July rally is near SPX 4,350. The SPX closed 08/16/23 at 4,404 and could reach 4,350 on 08/17/23.”
On the S&P 500 (SPX) 08/18/23 open it reached 4,350 and quickly bottomed out at 4,335. Could this be the beginning of a significant rally? Elliott wave patterns and Fibonacci analysis suggest the 08/18/23 rally could be quickly retraced.
The daily SPX chart courtesy of Trading View illustrates the action since the October 2022 bottom.
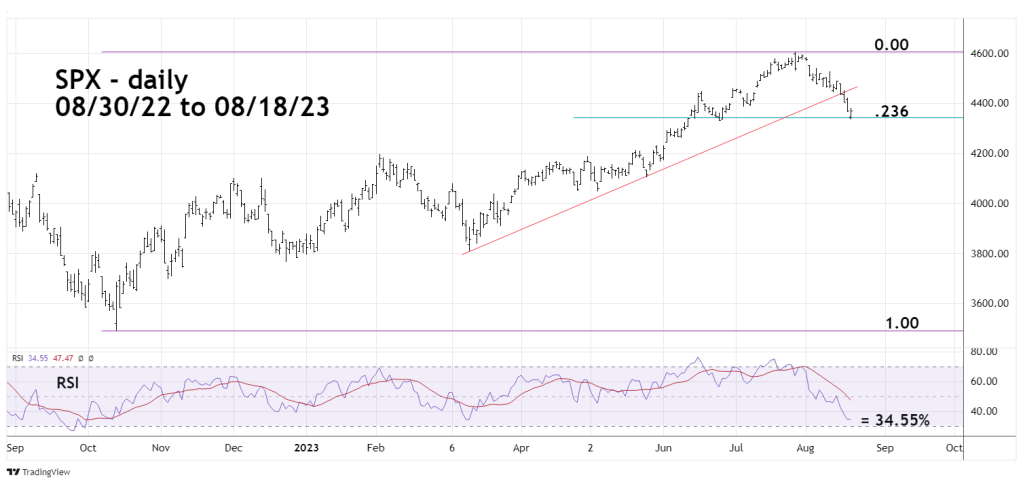
The decisive break below the multi- month rising trendline is additional evidence that the main trend has shifted to the downside.
The SPX 08/18/23 bottom was just below a Fibonacci .236 retracement of the October to July rally and just above chart support.
The RSI is like a fuel gauge indicating when a price movement could end. The reading on 08/18/23 was 34.55%. The oversold zone begins at 30%. The SPX could soon begin at least a multi-day rally.
The next daily SPX chart examines the rally from March to July.
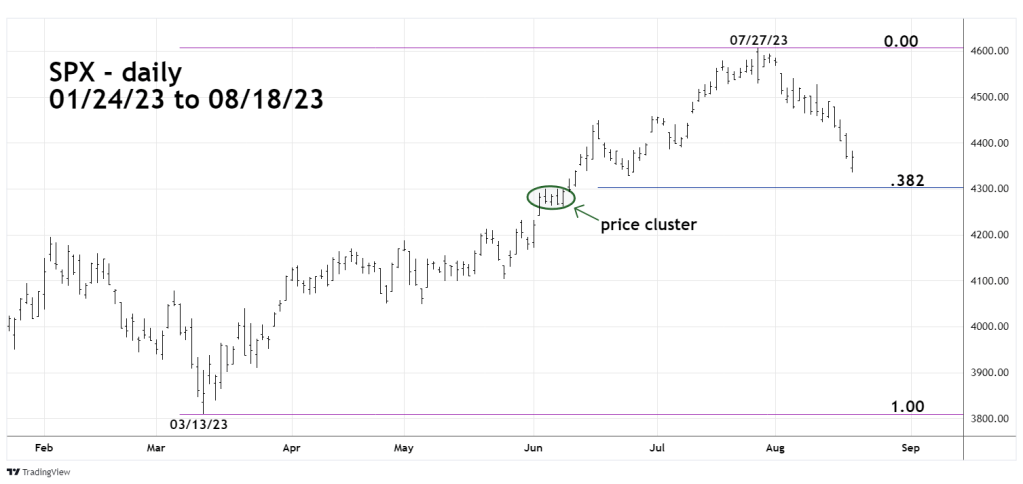
The basic lesson from the Elliott Wave Theory is to analyze price movements in segments. In this case it’s a segment of the October to July rally from 03/13/23 to 07/27/23.
A Fibonacci .382 retracement of this rally is at 4,302.16 which is just above a price cluster that could provide support.
Elliott wave analysis of the SPX decline from 07/27/23 provides additional evidence that a short-term bottom could be made near 4,300. The 15 – minute SPX chart illustrates the most likely Elliott wave count.

The move down from the SPX 07/27/23 top appears to be an extended Impulse wave in which the move down from 08/10/23 – presumed Minute wave “v” – boxed is also extended.
An important clue to the wave structure is where the rally on 08/18/23 ended. A Fibonacci .236 retracement of the Minute wave “4” top at 4,527.37 to the 08/18/23 bottom is at 4,380.63. The actual top of the 08/18/23 rally was 4,381.82.
Additionally, there’s usually a Fibonacci relationship between waves “two” and “four”. The presumed Minuette wave (ii) is 46.35 points. The presumed Minuette wave (iv) is 46.51 points very close to the Fibonacci ratio of 1/1 or equality.
The .236 retracement of the move down from 4,527.37 is typically where a fourth wave could terminate. This factor plus the equality of two intervening rallies is powerful evidence that a fourth wave probably terminated at the 08/18/23 high.
The 30 – minute SPX chart shows additional Fibonacci analysis indicating a short-term bottom could be made near 4,300.
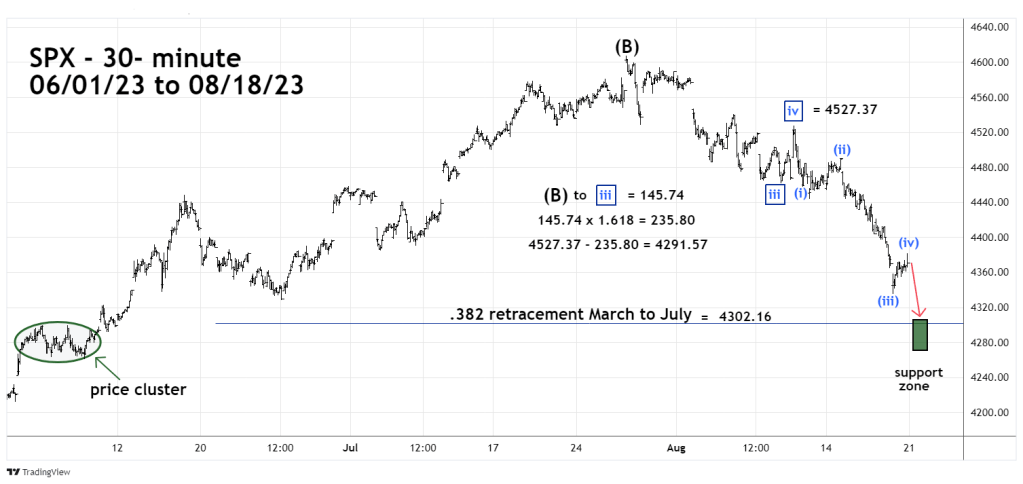
Sometimes within an Impulse wave there’s a Fibonacci relationship between the length of waves “one” to “three” and wave “five.”
In this case the length of the move down from the 07/27/23 top to the presumed Minute wave “iii” is 145.74 points multiplied by the Fibonacci inverse ratio of 1.618 equals 235.80 points. Subtracting 235.80 from the Minute wave “iv” top at 4,527.37 targets 4,291.57 close to the primary Fibonacci coordinate of 4,302.16.
Emphasis on possible short – term bottom. If a low is made near 4,300 a subsequent rally may only last a few days. Since the start of August, the declines have been relentless, and the rallies are brief. Seasonal stock patterns are bearish into October. There’s a high probability that U.S. stocks are currently only in the early part of a larger developing bear trend.
