The have been three instances in the past twenty – five years when the S&P 500 (SPX) made an important top in July and an important bottom in October. A study of these declines could provide clues to a potential SPX July to October 2023 drop.
Market forecasting is similar to weather forecasting. By studying prior storms, you can estimate the length and intensity of future storms. In terms of stock market forecasting the “storms” are declines.
The daily SPX chart courtesy of Trading View illustrates the July to October 1998 bear phase.
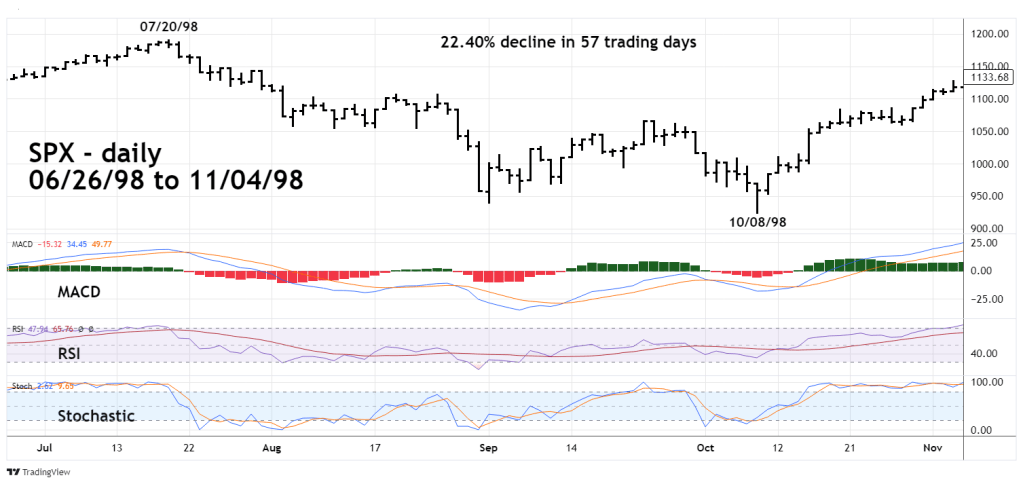
This is the largest of the three July to October SPX declines, lasting 57 – trading days and falling 22.40%.
When examining the weather – temperature, wind speed and barometric pressure are gauged. For the study of stock markets, MACD, RSI, and Stochastic are the tools of measurement.
Please examine where the three oscillators were about a week after the July 1998 top. Then compare their positions to the current daily SPX – MACD, RSI, and Stochastic readings. They are all at about the same level, indicating the current SPX drop could continue for at least one or two weeks.
The next daily SPX chart looks at the July to October 1999 decline.
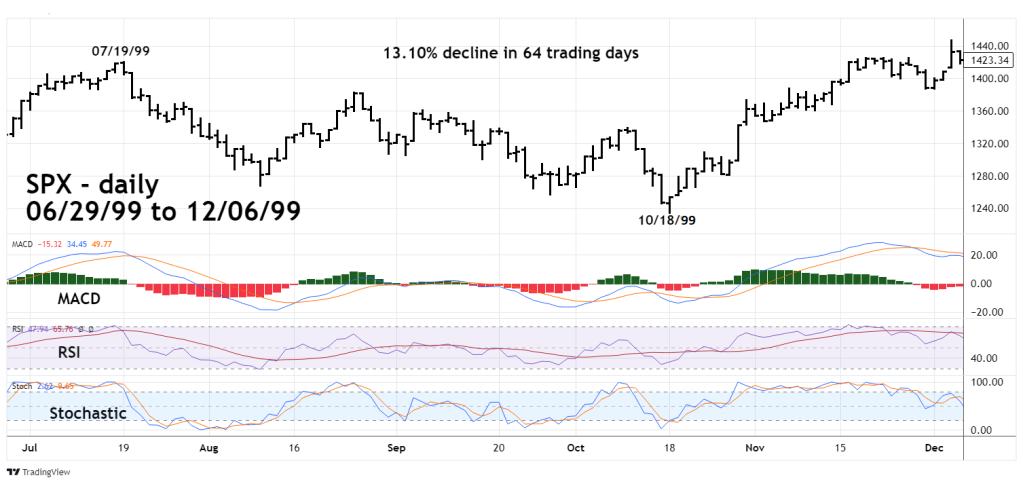
In price this was the smallest of the three declines, falling only 13.10%. In time it was the longest lasting 64 – trading days.
Note that the daily RSI was effective in identifying the first bottom made in August 1999 as it touched the oversold boundary at 30%. There was an RSI bullish divergence at the short – term bottom made in September 1999. Then another bullish RSI divergence as the final bottom was made in October 1999.
The next daily SPX chart illustrates the July to October 2011 decline.

In this situation the SPX primary peak was made in the seasonal topping zone of late April/early May. The SPX made a double top in early July and the bulls were able to manage a slightly lower peak on 07/21/11. The subsequent drop was vicious, falling 18% in about three -weeks. This was the bulk of the 2011 decline. After the August bottom there was a trading range before the final bottom was made in early October 2011.
Please note the significant bullish RSI and MACD divergences at the October bottom vs. the August low.
The next daily SPX chart brings us to the current market.
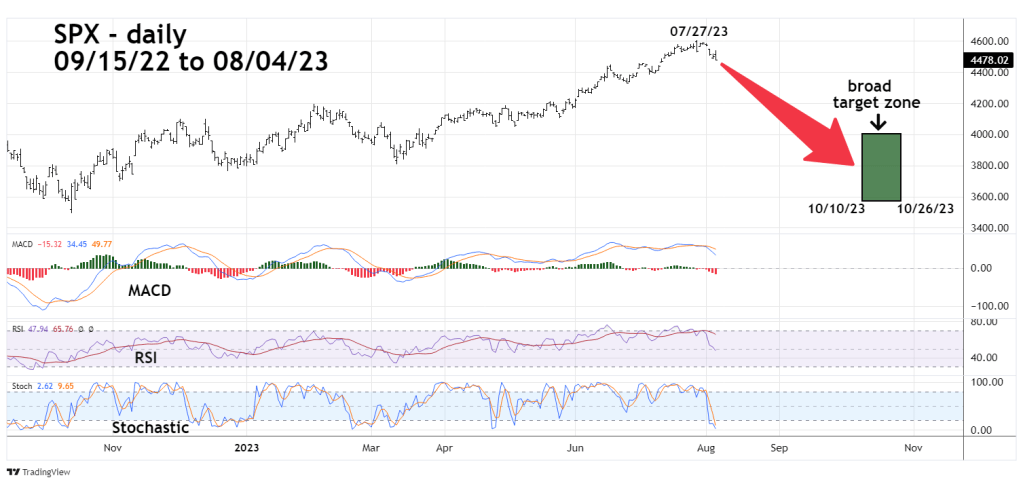
Using the parameters of the prior July to October declines we can make a price and time projection for a possible 2023 July to October bear phase.
The time range of the prior declines was 52 to 64 trading days. The declines were from 13.10% to 22.40%. This projects a possible SPX drop to 4,000 to 3,570 in the time zone of 10/10/23 to 10/26/23.
This blog can act as a template for SPX action in the coming weeks. Either to validate or invalidate the theory of an import SPX bottom in October 2023.
It is possible the SPX could go below the October 2022 bottom. This scenario will be examined in a future blog, assuming the SPX continues to decline.

Did you also look for examples of shorter and shallower declines in the past history with momentum indicators similar to today’s market? Shorter and shallower declines seem a lot more likely than the three examples of declines provided in the blog simply because long and deep declines such as the three historical declines cited in the blog are much more rare than shorter and shallower declines. The decline of February 2023 is a perfect example of a shorter, shallower decline that started from a similar daily RSI peak.
LikeLike
Hi David
Thanks for the comment. I did not look at any shorter and shallower declines because I’m using the three examples to either validate or invalidate the theory of a 2023 SPX July to October decline. As of today 08/08/23, the SPX is only down 3% from the 07/27/23 top. It’s possible the SPX is currently in a short shallow decline. We may have an answer in a few trading days.
Mark
LikeLike