This websites prior blog noted that statistically 07/03/23 could be a bullish day, and because of the shortened trading day any new rally high could be marginal. Today 07/03/23 all three of the main U.S. stock indices closed the day up. None of the indices made a new post October 2022 rally high – the bearish “rule of the majority” signal remains valid. The VIX topping signal also remains valid.
What’s missing from the developing bearish evidence are Fibonacci price or time relationships. Measured by the S&P 500 (SPX) as of 06/30/23 has retraced .72 of its January to October 2022 decline – not a Fibonacci ratio. There’s also no Fibonacci time relationship between the January to October 2022 decline with the October to June 2023 rally.
Perhaps the October to June bull move can be compared to a bull phase from several years ago?
Prepare to have your mind blown!
The weekly SPX chart courtesy of Trading View compares the October to June 2023 rally with the 2018 to 2020 bull market.
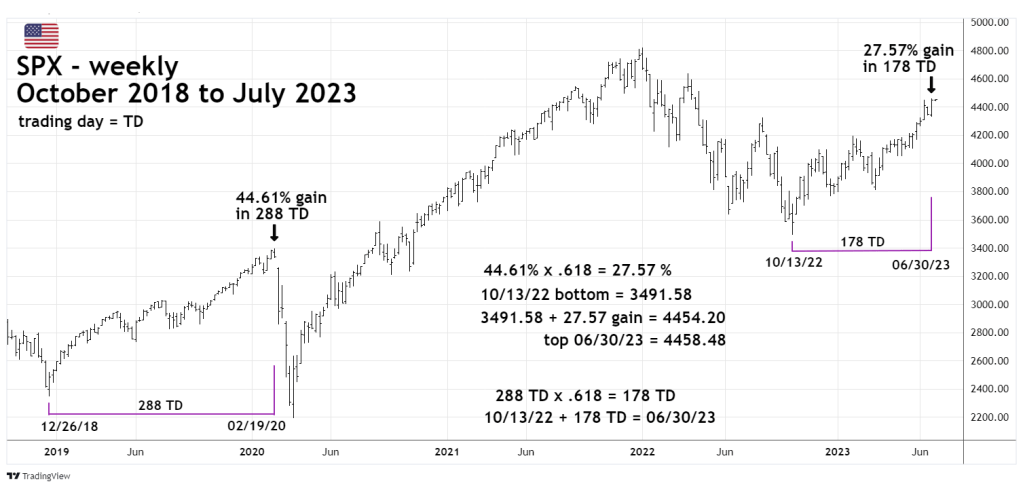
The SPX 12/26/18 to 02/19/20 bull market lasted 288 trading days (TD) multiplied by a Fibonacci .618 yields 178 TD. Adding 178 TD to the 10/13/22 bottom targets 06/30/23.
The 2018 to 2020 bull phase gained 44.61% multiplied by .618 equals 27.57%. Adding 27.57% to the 10/13/23 SPX bottom of 3,491.58 targets SPX 4,454.20. The high on 06/30/23 was 4,458.48!
Hitting the exact target day at almost the exact price is the equivalent to a Golf – hole in one shot.
The 06/24/23 blog “Potential Spiral Calendar Turn Due – June 2023” noted a turn date of 06/26/23 with leeway out to 07/03/23.
The 06/25/23 blog “Potential Fibonacci Time Ratio Turn Due – June 2023 had a bullseye turn date on 06/29/23.
Also, today 07/03/23 is a full moon. Markets can sometimes have turns on full/new moons – plus or minus 2 trading days.
These three-time cycle methods plus the calculations in this blog strongly suggest a very important turn down could developing.
This could be a fantastic opportunity to profit from downside action in U.S stocks.
At the open of the SPX session on 07/05/23 establish a 100% position on SPX – non leveraged inverse Exchange Traded Funds. Use a move above SPX 4,550.00 as a stop loss on half of the position.

Interesting! How you got to this insight is mastery to me.
My personal indicator also flashes highly overbought SP500, hence we are aligned.
We shall see…
Congratulations on your research, but also respect for your blog.
LikeLike
Thank you for compliments.
LikeLike