The something big could be a multi – month decline to at least the S&P 500 (SPX) October 2022 bottom.
The SPX 15 –minute chart courtesy of Trading View examines the short – term picture.
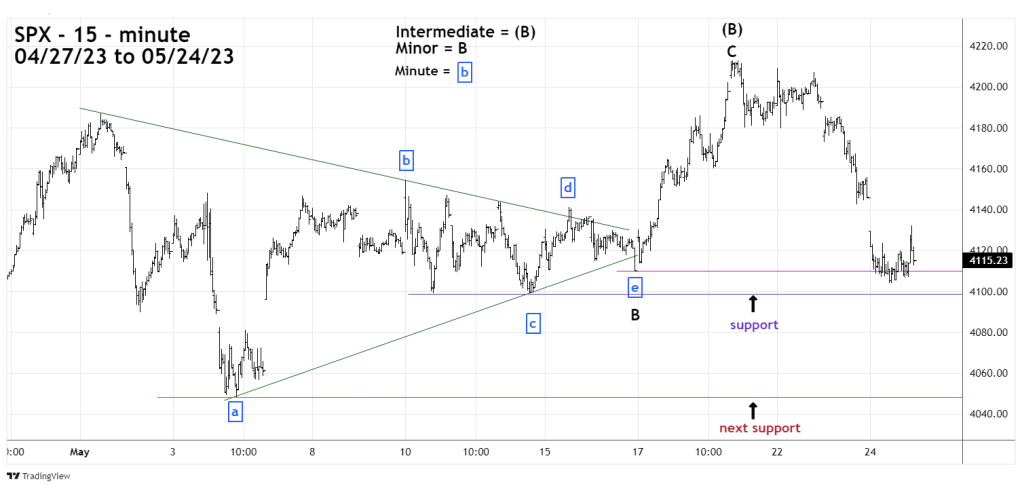
The SPX drop from its 05/19/23 top appears to be a developing Elliott impulse wave and today, 05/24/23 broke below the 05/16/23 bottom at 4,109.86. This level appears to be the point of origin of a post Elliott wave – Horizontal Triangle thrust up. The break below 4,109.86 also completely retraced a five-wave impulse pattern, invalidating what could have been the first wave up of a larger developing five wave formation.
If the SPX can break below the double bottom at 4098 to 4099 it could open the door for a move down to 4,048.28.
The daily SPX chart illustrates the importance of this support level.

Prior blogs on this site illustrated that 4,048.28 was probably the bottom of an Elliott wave – Expanding Flat. Just below 4,048.28 is the Fibonacci .236 retracement of the SPX October to May rally at 4,042.68. These two nearby points are potentially powerful support and could require a powerful decline to break.
If the SPX can break below this dual support it could propel a drop to the 12/22/22 bottom at 3,764.49 which is just below a Fibonacci .618 retracement of the October to May rally at 3,767.13.
Daily MACD has a bearish lines crossover, and daily RSI has moved below its moving average line. These signals imply a near-term drop into the first week of June 2023.
If the SPX peak at 05/19/23 holds; the down phase could continue into the end of the bearish season – October 2023.
The minimum downside target is at or just below the SPX October 2022 bottom.
Based on longer – term SPX – Elliott wave analysis the down move could go significantly below 3,491.58. If the current decline continues, a future blog will examine lower downside targets.

NVDA blowout 1/4 could help keep thing afloat for now
LikeLike
We could find out soon.
LikeLike
I think you may be right. It certainly looks like an impulsive decline.
LikeLike
Thanks for the comment.
LikeLiked by 1 person
I also thought the decline coming off the May 1st high was an impulse wave with a truncated 5th wave down there—and it could have been, though clearly it was still part of a corrective motion, as it went on to make a new high. But I think this one might stick. Cheers.
LikeLike
Thanks for the information.
LikeLike