For several months the UK 100 (UKX) has had very clear Elliott wave patterns. The clarity continues, and this week the UKX could make a secondary peak in a developing bear market.
The daily UKX chart courtesy of Trading View illustrates the Elliott wave count.
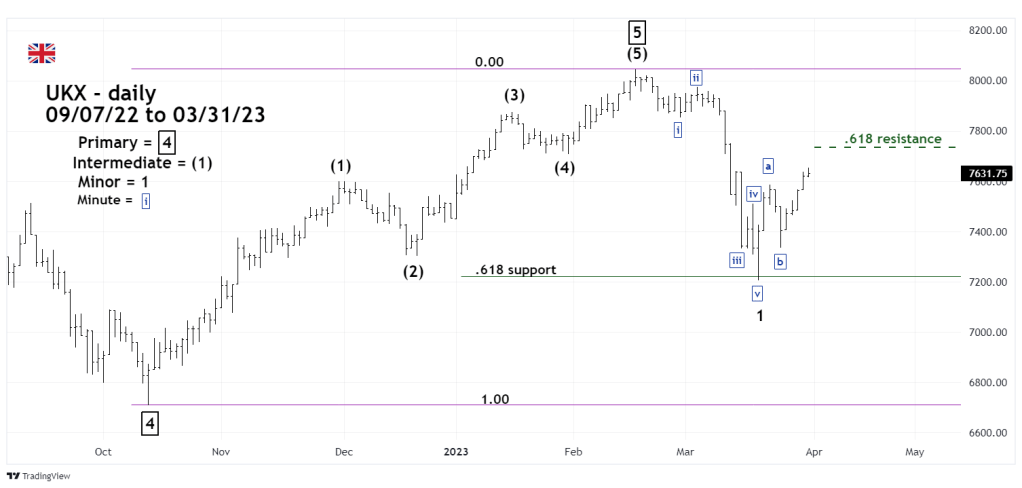
The 03/13/23 blog “Major UK 100 Top is Probably in Place” noted that from October 2022 to February 2023 the UKX had a clear Elliott – five wave Impulse pattern. Subsequently the UKX decline 10% bottoming almost exactly at a Fibonacci .618 retracement of the October to February rally.
The decline was in a five wave impulse which implies it’s the first wave down of a larger developing drop. The rally off the 03/20/23 bottom is so far in the form of a three-wave corrective pattern. The most likely stopping point of the current rally is in the area of a .618 retracement of the February to March drop.
The action from the February top to the March bottom is a near textbook Elliott five – wave Impulse. The only area of doubt is the presumed Minute wave “iv” – boxed. Note that this structure is smaller in time than the presumed Minute wave “ii”.
The .618 retracement of the February to March drop is the area around 7,725. If the UKX exceeds this area the next resistance zone is 7,850 to 7,975 – chart cluster below Minute wave “ii”.
