Traders that mainly use Technical Analysis should also devote some attention to Fundamental Analysis. Recently, bearish economic signals have increased the need to focus on Fundamental factors.
First a Technical update on U.S. stocks. The 15 – minute S&P 500 chart courtesy of Trading View illustrates the Elliott wave count just prior to and after the FOMC interest rate decision.

The pattern from the early peak on 03/22/23 to the early bottom on 03/24/23 looks very much like an Elliott wave – Expanding Flat correction. When correcting bull trends this structure is composed of three waves down, then three waves up that marginally exceed the corrections point of origin. The structure completes with five waves down. Sometimes the five waves down can take the form of an Elliott wave – Ending Diagonal Triangle. The decline has a wedge shape and a fifth wave trendline throwover.
Just based on the Elliott wave evidence there’s a high probability a short – term bottom is in place as of 03/24/23. The 5 – minute SPX – Point & Figure chart provides additional bullish evidence.

The SPX decline on 03/24/23 stopped in the area of four columns of Point & Figure support. The 03/11/23 blog “Stock Market Fuel” noted the SPX had Point & Figure support at 3815. Subsequently on 03/13/23 the SPX bottom just below the support at 3808.
The 15 – minute SPX and Nasdaq 100 (NDQ) chart updates their relationship.
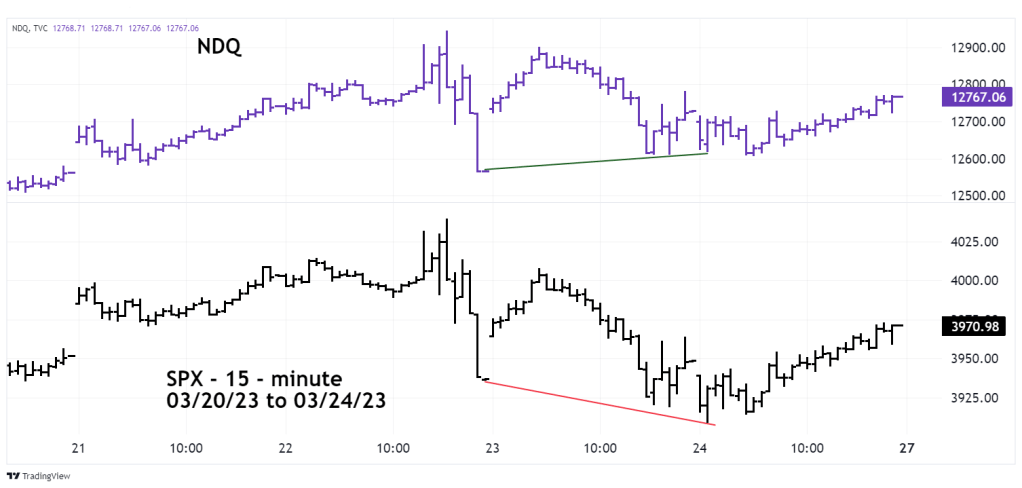
The 03/22/23 blog “Fed Decision Day – Part – Two” noted that the NDQ was relatively more bullish than the SPX. During the sharp drop on 03/22/23 the SPX retraced 44% of its 03/13/22 to 03/22/23 rally while the NDQ only retraced 23%.
The relative bullish strength of NDQ continues. Note that while the SPX went below its 03/22/23 bottom, the NDQ held above its 03/22/23 low.
During the 2022 bear phase the SPX fell 27%, the NDQ dropped 37%. The weaker stock index has now become the stronger index, a hint U.S. stock could continue to rally.
The big question is how long could a rally last? Days, weeks, or months? This is where Fundamental Analysis comes into play. The 03/18/23 blog “Could the U.S. Federal Reserve be Trapped” illustrated that the U.S. inflation spike since 2021 is similar to what happened in the late 1960’s. The current inflation spike has triggered an interest rates rise. The current U.S. economic fundamentals are the most bearish in over fifty years, and at some point could cause a steep drop in stock prices.
We’ve already seen a notable instance when U.S. stocks, at least for now have stalled out. The 02/02/23 blog “Golden Cross Signal – 02/02/23” illustrated the SPX – 50 – day moving average line had moved its 200 – day moving average line called a “Golden Cross”.
The blog noted probability analysis of prior Golden Cross signals hinted U.S. stocks could rally beyond May 2023. How long did the rally last? One day!
So far the SPX, Dow Jones Industrial Average, and Nasdaq Composite are still below their 02/02/23 highs. Only the NDQ is above its 02/02/23 peak, which as noted gives a hint U.S. stocks could continue to rally. If U.S. stocks do rally its possible none of the other three stock indices could exceed their 02/02/23 highs.
In the short-term there’s evidence the SPX made a bottom on 03/24/23, we also need to be aware of the Fundamental situation. When you have two major U.S. bank failures and problems with major banks outside of the U.S. it means the global economy could be entering a deep contraction.
An SPX break below its 03/24/23 bottom could be a significant warning.
