The 02/09/23 blog “Price Forecast for UK 100 Major Top” noted that a multi-year rising trendline and two Fibonacci coordinates implied the broad zone for a major top was 8,050 to 8,300. On 02/16/23 the UK 100 (UKX) reached 8,047, this could be a major top!
The monthly UKX chart courtesy of Trading View shows the long-term picture.

MACD had bearish divergences on lines and Histogram.
RSI had a bearish divergence and subsequently a bearish cross below its moving average line.
Stochastic has a bearish lines crossover.
These monthly level momentum signals imply the beginning of at least a multi-month UKX decline.
The weekly UKX chart illustrates the Elliott wave count from the March 2020 bottom.
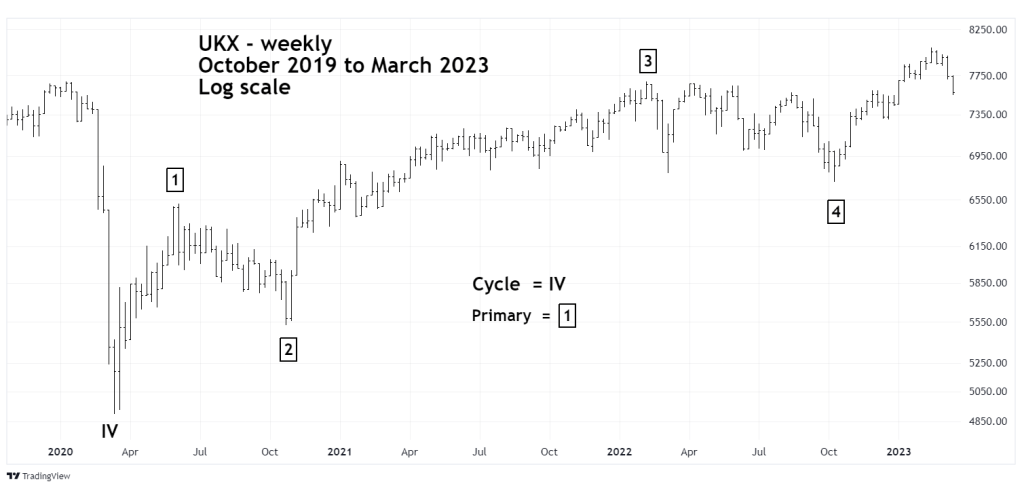
There’s a high probability that the rally from the March 2020 bottom has taken the form of an Elliott five – wave Impulse pattern. To determine if a major top could be in place we need to see if the presumed Primary wave “5” – boxed subdivides into five waves.
The daily UKX chart zooms in on the rally from October 2022 to February 2023.
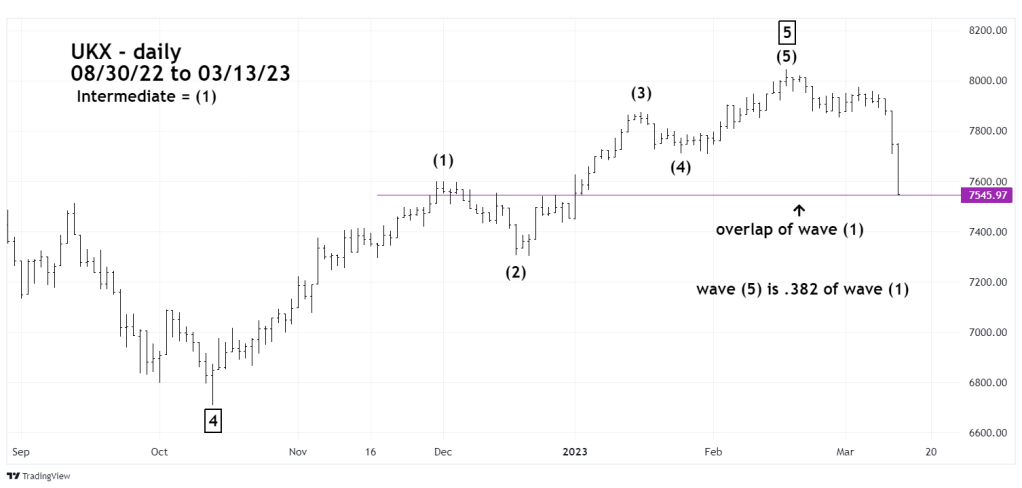
The rally from October to February has taken the form of a five-wave impulse pattern. There’s usually a Fibonacci relationship between waves “one” and “five” of Elliott motive pattern. In this case Intermediate wave (5) is .382 the size of Intermediate wave (1).
Additionally, today the UKX decline crossed over into the area of Intermediate wave (1). This invalidates an alternate wave count that the drop from 02/16/23 is Intermediate wave (4). In Elliott Impulses waves for stock indices wave “four” can not overlap into the area of wave “one”.
Could a probable UKX major top mean that other national stock indices have peaked? Its possible however stock market tops are usually diffused. In 2022 the S&P 500 topped in January, the UKX 2022 top came in February.
The UKX recent signals are a bearish warning for global stocks.
