The 02/14/23 blog noted that if the Dow Jones Industrial Average (DJI) broke below channel line support at 33,581.42 it could open the door for a move down to at least 33,000. Early in the DJI 02/17/23 session there was a break below channel line support. The bears had almost an entire session to smash prices lower; they failed miserably.
The 15 – minute DJI chart courtesy of Trading View illustrates the action.
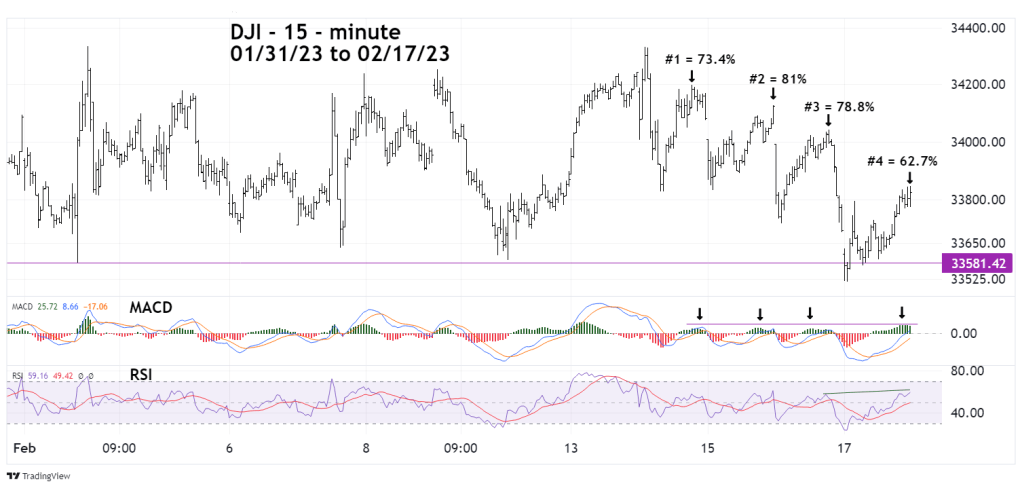
The following are the bullish factors that occurred since the top made on 02/14/23.
- Bearish exhaustion. The break below support happened in the first two – minutes of the 02/17/23 session. After a brief rally the decline resumed but only going three – points below the opening bottom. The next six – hours the trend was up.
- Strong retracement rallies. After the top made on 02/14/23 at 34,331.47 there were three successive counter-trend rallies each with retracements greater than 70%. This indicates strong bullish resistance to the prevailing down trend. Another factor is the number of rallies since the 02/14/23 top. Usually after a top there are just two countertrend moves before a sharp decline occurs. This decline counting the 02/17/23 rally has four.
- Bullish MACD. Rally # 4 retraced 62.7% of the prior decline or a ratio of .627 which is close to the Fibonacci ratio of .618. A case could be made that because rally # 4 had the weakest percentage retracement, and near Fibonacci resistance, that the rally was exhausted. However examine the MACD – Histogram which is higher than the readings for the prior three rallies. This is a bullish divergence and implies higher near-term prices.
- Bullish RSI. The RSI reading on the 02/16/23 price peak was 57.36. The RSI reading on 02/17/23 with a lower price peak was 59.17, another bullish momentum divergence.
Downside price exhaustion, deep retracement rallies, and bullish momentum divergences strongly imply higher prices.
The nine- wave Elliott – Horizontal Triangle illustrated in the 02/14/23 blog is no longer valid. There could still be a Horizontal Triangle forming from the DJI high made in January 2022. The most likely alternate wave count has the 02/17/23 bottom as possibly wave (G) of a developing nine – wave Horizontal Triangle.
Seasonal Stock patterns are bullish until late April/early May. If U.S stocks continue to rally, the DJI could make a new all – time high in April or May 2023.
