The U.S economy is suffering the highest inflation rates in forty years. The FOMC has been aggressively raising short -term interests rates. Is it possible for the S&P 500 (SPX) to rally above its 12/13/22 – 4,100 top? Two examples illustrate that the SPX can have persistent bear market rallies regardless of bearish factors.
The first example is from 1999 to 2001 illustrated in the weekly SPX chart courtesy of Trading View.
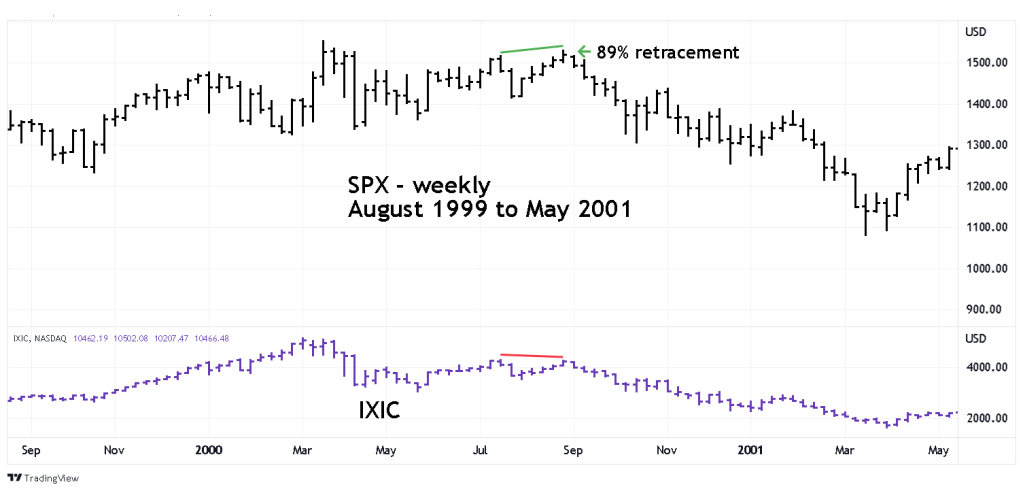
After nearly a decade of growth the U.S economy in mid – 2000 was showing signs of weakness. One of the strongest signals of a potential economic decline came from the Nasdaq Composite (IXIC) which had been the leader of the powerful 1998 to 2000 bull market. This index in about two months collapse 40%, a sign that U.S stocks had probably entered a bear market that could continue well into 2001.
However, shorting the SPX was difficult. By July 2000 the SPX had retraced 83% of its decline from the all-time high made in March 2000. This deep retracement probably freaked out the bears, yet the bulls still had not given up the fight. After the SPX July peak there was a sharp 6% drop that broke an important support level. The bulls then started another attack, exceeding the July top and retracing 89% of the initial bear market drop.
The next example comes from the 2015 to 2016 SPX bear move illustrated in the daily chart.
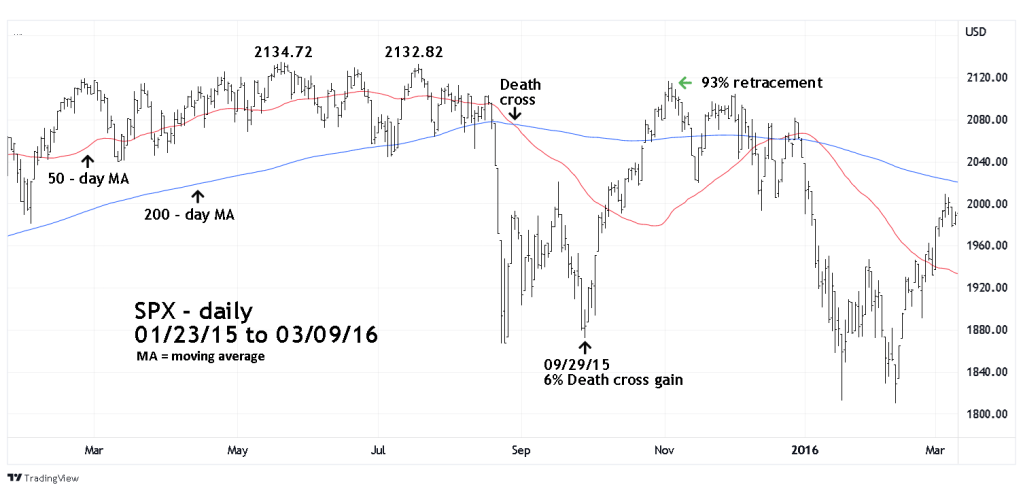
Note the second top came two months after the primary peak in May 2015. Then even after a mini crash the SPX still managed to retrace 93% of the initial bear move.
The most bearish evidence of the 2015 to 2016 bear move came from the collapse of new 52 – week highs.
The weekly chart of NYSE new 52 – week highs ($NYHGH) courtesy of StockCharts.com shows what happened.
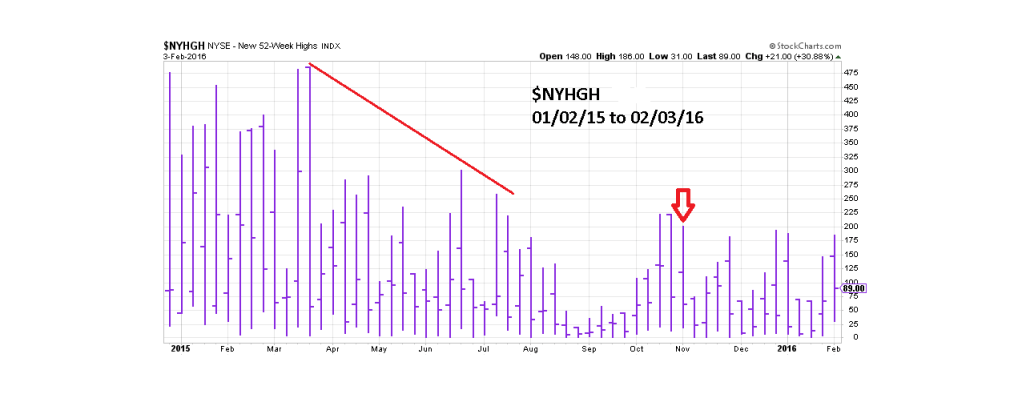
The decline in new highs started even before the top in May 2015 and continued to deteriorate as the SPX made a double top in July 2015. Note that there was no increase in 52 – week highs as the SPX made its November 2015 top.
One other interesting event occurred during the 2015 to 2016 bear phase and that was the Death cross in August 2015. Just prior to the Death cross many in the financial media were warning of its approach. When the cross happened the media was screaming , Death Cross! Death Cross! Death Cross!
Note the cross happened after the mini crash bottom. Regardless the bears were still able to get an effective signal because the cross came on a short- term bounce. How effective was this widely advertised signal? A maximum of 6% gain before the subsequent bull move wiped it out.
The SPX is probably the most watch stock index in the world. The 200 – day moving average and trendlines are probably the most used technical analytical tools.
On 12/13/22 the SPX topped in the area of the 200 – day moving average and declining trendline from the January 2022 high. Subsequently the SPX declined 7%. January 2023 could give us the answer to what happens after another widely advertised signal.
