The prime S&P 500 (SPX) Elliott wave count from the 12/22/22 bottom is a series of “one’s” and “two’s” up. This is the most bullish Elliott wave configuration and the prelude to a powerful move up.
The SPX 15-minute chart courtesy of Trading View illustrates the action.
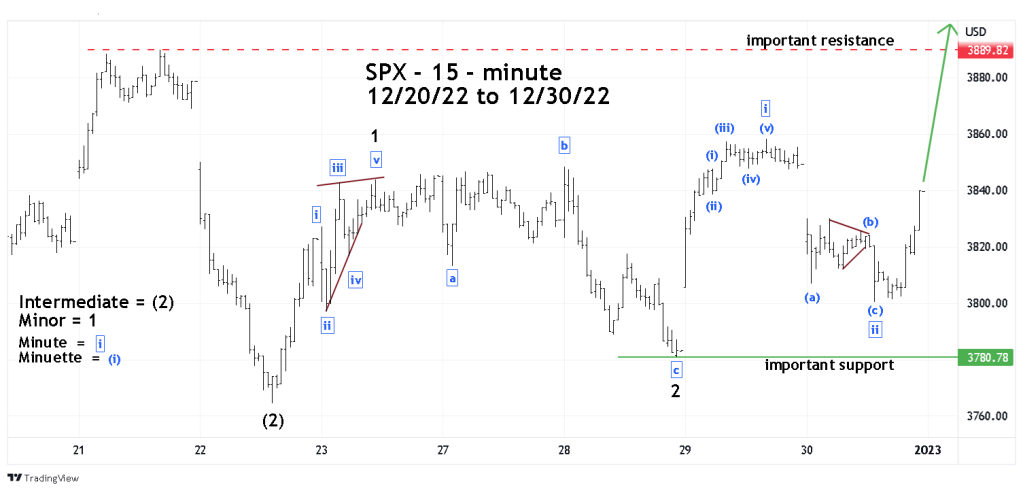
Minor wave “1” is a Leading Diagonal Triangle.
Minor wave “2” is a Combination wave – composed of the following sub waves.
Minute wave “a” is an Expanding Flat.
Minute wave “b” is a Double Zigzag.
Minute wave “c” is a Single Zigzag.
Within Minute wave “ii” – Minuette wave (b) is a Horizontal Triangle.
Ideally the lesser degree impulse and corrective waves are smaller in both price and time compared to the larger degree impulse and corrective waves.
In this case Minute waves “i” and “ii” are smaller in price and time compared to Minor waves “1” and “2”.
There are always alternate wave counts, in this situation the move up from 12/22/22 to 12/29/22 could be counted as a Single Zigzag.
Minor wave “1” would be Minor wave “A”.
Minor wave “2” would be Minor wave “B” .
Minute wave “i” would be Minor wave “C”.
This alternate wave count would become the prime wave count if the SPX breaks below the bottom made on 12/28/22 at 3,780.78.
The 2023 edition of “Stock Trader’s Almanac” – SPX Probability Calendar shows the SPX bullish for the first four trading days of 2023, with 01/05/23 with the greatest chance of being a bullish day.
