Elliott wave theory has two basic modes – Motive waves which move with the primary trend and Corrective waves which are corrections to the primary trend. There are three variations of Motive waves and ten variations of Corrective waves. This blog can serve as an aid to differentiating between Motive and Corrective patterns even without knowing the details of thirteen different wave variations.
Corrective waves are generally slower and shallower than Motive waves. The Dow Jones Industrial Average (DJI) decline from 01/05/22 to 10/13/22 looks very much like a corrective pattern. The subsequent powerful rally so far appears to a motive pattern – particularly an Impulse wave.
The daily DJI chart courtesy of Trading View illustrates the decline and rally since the all-time high in January 2022.

The DJI post March 2020 rally into the January 2022 peak was a Motive wave. The subsequent decline into the October 2022 bottom appears to be a correction of the prior 22 – month upwards progress.
Note that the angle of the January to October drop was only 28%, this is a typical shallow angle of Corrective waves. The movement up from the October bottom is at an angle of 67%. This steep angle is typical of Motive waves. Sharp movements like this are usually seen in the kickoff phase – the start of a larger movement, or at the blowoff phase – the end of a larger movement. In this case its probably the blowoff phase of the secular bull market that began in March 2009.
The time ratio difference between the Corrective and Motive waves is amazing! The decline phase took 194.5 trading days (td). The rally phase so far is only 30.5 td, a ratio of only 30.5/194.5 = .156. Additionally, the DJI has now retraced 69% of its January to October drop. This is an incredibly powerful move up, the DJI has a good chance of reaching or exceeding the all-time high made in January 2022.
The hourly S&P 500 (SPX) chart zooms in on the near-term action.
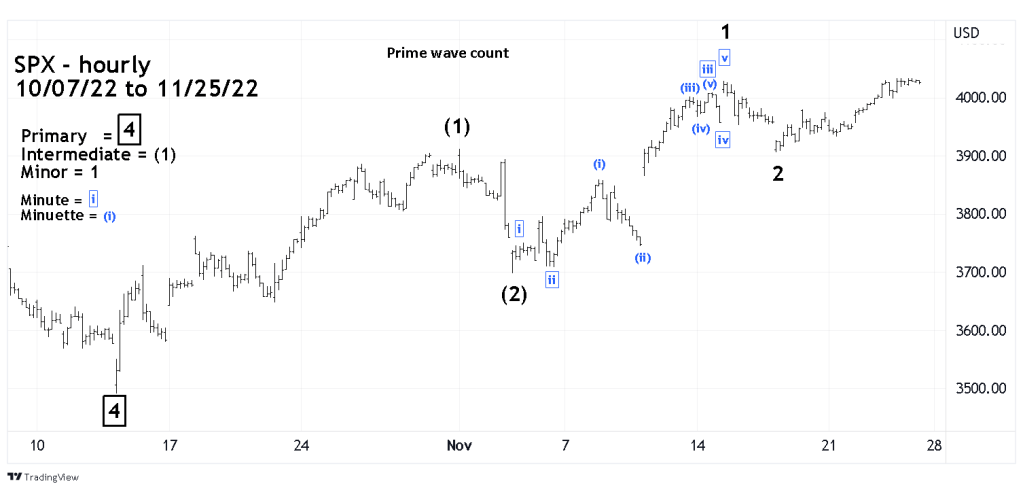
The SPX could be forming a series of “one’s” and “two’s” up from the 10/13/22 bottom. This sequence is usually the set up for a very dynamic movement in the primary trend – in this case up. An example of a series of “one’s” and “two’s” up is shown on the chart. Note the action after the presumed Intermediate wave (2) bottom. Also note the dynamic move up after the presumed Minuette wave (ii) bottom.
This type of set up is what could be needed to break through possible powerful resistance noted in the 11/23/22 blog “S&P 500 Approaching Potential Resistance”.
The next chart illustrates an alternate Elliott wave count.
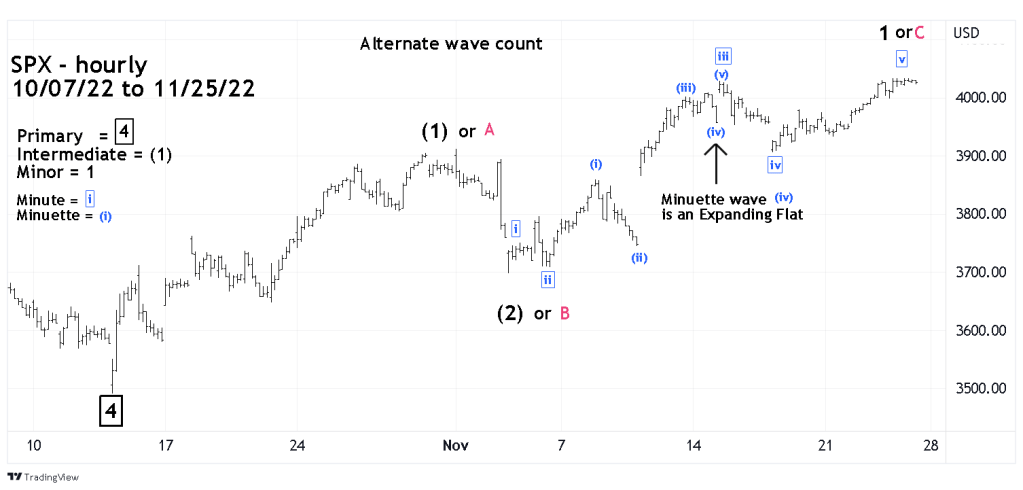
There are always alternate Elliott wave counts, there’s no predestination in markets or stocks and analysts need to be prepared for alternate courses.
In this wave count the presumed Minor wave “1” is either complete or nearing completion. It could also be wave “C” of an (A, B, C) off the 10/13/22 bottom. If the (A, B, C) wave count is correct it presumes the SPX 200 – day moving average could stop the current rally. A move down from the presumed Minor wave “C” top could retest or breakthrough the 10/13/22 bottom.
What happens in the week of 11/28/22 to 12/02/22 could determine if the current rally continues or dies.
