The S&P 500 (SPX) could soon be in a price zone that the bears aggressively defend.
In warfare you can estimate where a future battle could happen based upon geographic features. Technical analysis of markets is similar because you can see on a price chart where there’s potential support/resistance.
The 11/10/22 blog “Follow the Leader – Part – Two” noted that when the Dow Jones Industrial Average (DJI) moved above its 200 – day moving average (MA) and declining trendline it implied the rally could continue for several weeks.
The daily DJI chart courtesy of Trading View illustrates the subsequent action.
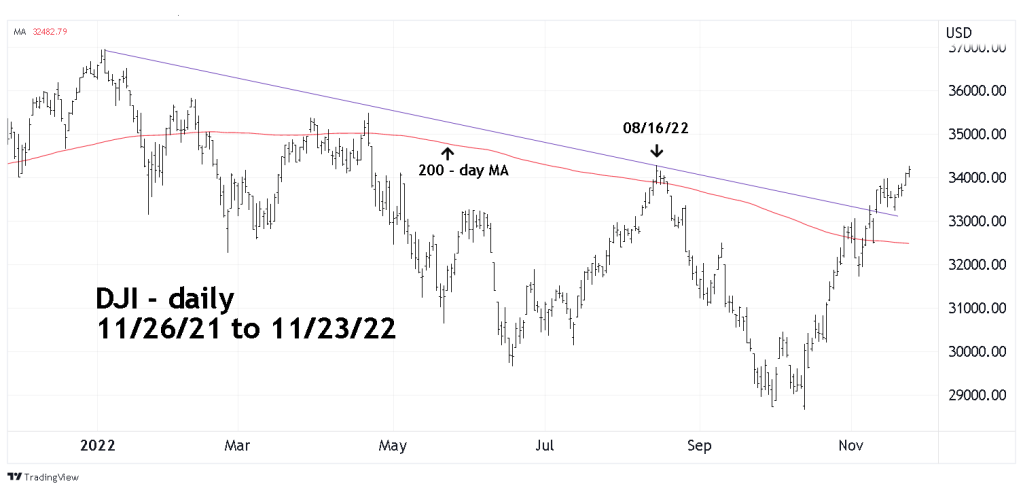
As of 11/23/22 the DJI was very close to its 08/16/22 peak.
The daily SPX chart shows its nearing the 200 – day MA and a declining trendline.

Most and perhaps all U.S stock fund managers base their performance off the SPX. Therefore, movements near its 200 – day MA have a greater significance than the other U.S stock indices. Sometimes a moving average indicator can be a self-fulfilling prophecy. In this case its possible the SPX in proximity to its 200 – day MA could trigger an increase in shorting and selling of long positions.
We may find out as soon as next week if this potential resistance zone holds. If there’s an increase in stock selling it could take a powerful buying to break through.
The next blog will show a possible very bullish Elliott wave pattern that could be developing.
